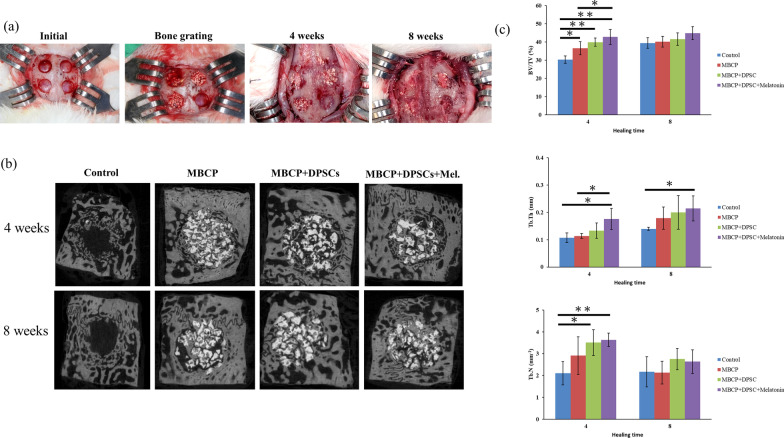
Fig. 9.
Clinical images of surgery, micro-CT scan, and three-dimensional reconstruction of the bone defects 4 and 8 weeks after implantation of the scaffold and DPSCs and statistical analysis. a Clinical images of surgery procedures and well healing status was presented at 4 and 8 weeks. b Sagittal planes of 3D reconstruction images of surgical bone defects after 4 and 8 weeks of scaffold and DPSCs implantation. c Bone histomorphometry based on micro-CT images, including bone volume (BV/TV), trabecular thickness (Tb.Th), and trabecular number (Tb.N). Results are expressed as mean ± standard deviation (SD) and statistical significance is represented as (*) p < 0.05 or (**) p < 0.01

