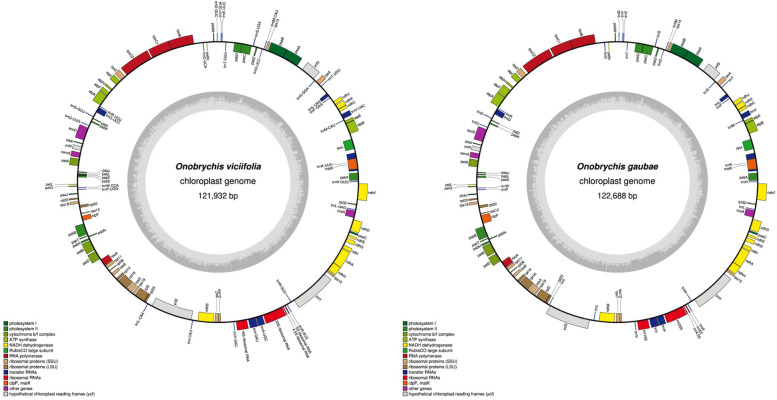
Fig. 1.
Gene map of two Onobrychis species chloroplast genome [O. viciifolia (MW007721) [29] and O. gaubae (LC647182)]. The genes drawn outside and inside of the circle are transcribed in clockwise and counterclockwise directions, respectively. Genes were colored based on their functional groups. The inner circle shows the structure of the chloroplast: The large single copy (LSC), small single copy (SSC) and inverted repeat (IR) regions. The gray ring marks the GC content with the inner circle marking a 50% threshold. Asterisks mark genes that have introns

