Fig. 1.
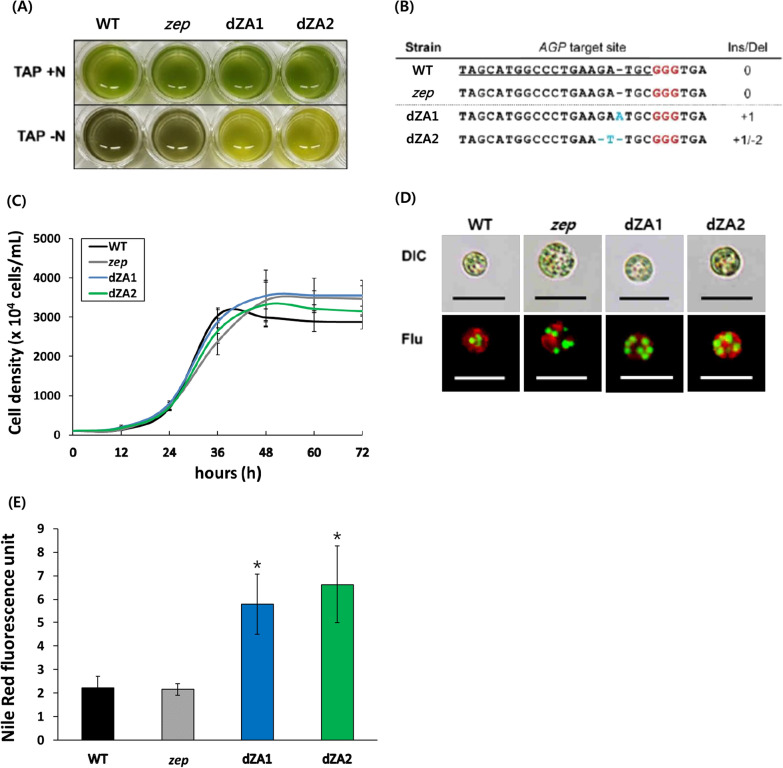
Morphological features and genomic sequence analysis of AGP knock-out mutants (dZAs). A Analysis of starch phenotype by iodine staining. After being cultured in the nitrogen-starvation medium, a cell was stained with iodine solution, and the dark green color indicates the presence of starch as in the lower panel. B Genomic DNA sequence alignment of AGP of the wild type, zep line, dZA1, and dZA2. The 20-bp target sequence is underlined, and the red character is the PAM sequence. Blue characters indicate the insertion or deletion sequence on the AGP site in the dZAs. C Cell growth of the dZA1 and dZA2 under normal conditions was compared to that of the wild type and zep line. The data shown are representative of three independent experiments (n > 9). Error bars indicate standard deviation. D Triacylglycerol (TAG) accumulation in the cells cultured in the nitrogen-starvation medium is visualized by BODIPY staining. The green dot indicates the oil droplet in the cytosol, and the red color indicates the chloroplast. The size bar represents 10 µm. E The fluorescence intensity of the cells cultured under nitrogen-starvation conditions after Nile red-staining. The data shown are representative of three independent experiments (n > 3)

