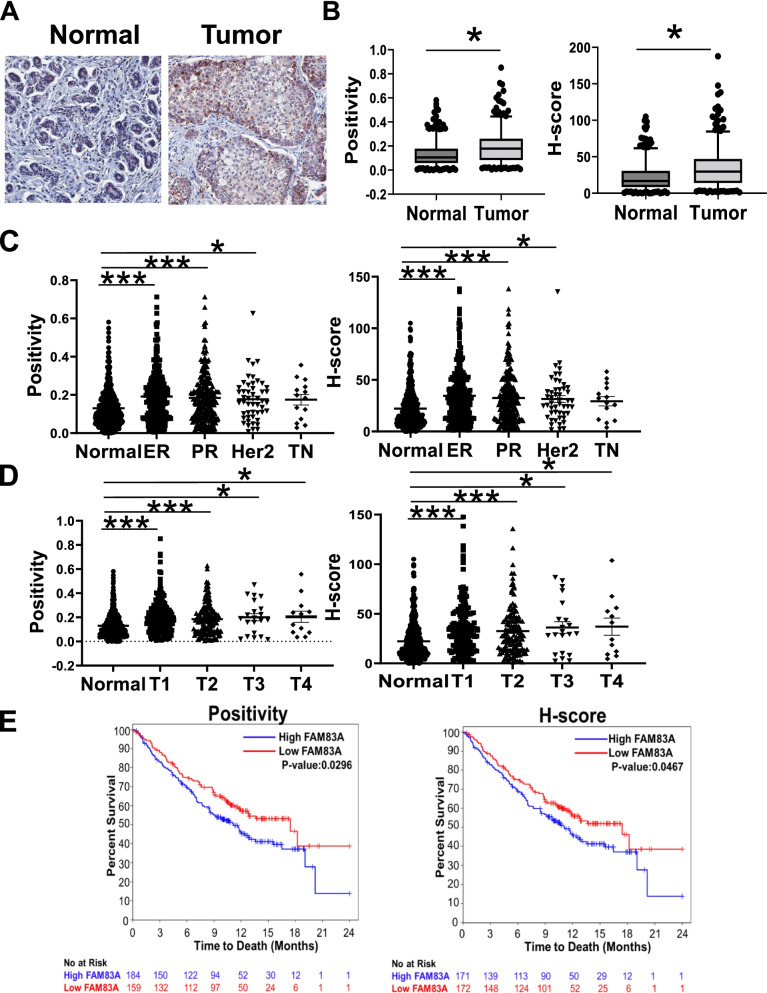
Fig. 1.
FAM83A expression in breast tumors. A Representative images at 20 X magnification and B quantification of FAM83A staining of either normal or tumor breast tissue sections. Data are shown as box and whisker at 5th-95th percentile. C FAM83A staining quantification in different breast cancer hormone receptor-based subtypes or D tumor stage (T1-T4) as compared with normal breast. Each dot represents a single subject data point. Data are shown as average ± standard error of the mean. E Kaplan–Meier survival curves of breast cancer patients based on FAM83A expression status for both positivity and H-score analyses (blue lines indicate patients with high FAM83A level; red lines indicate patients with low FAM83A level). ER: estrogen receptor, PR: progesterone receptor, Her2: HER2 gene amplification, TN: triple negative. *p < 0.05.**p < 0.001, ***p < 0.0001

