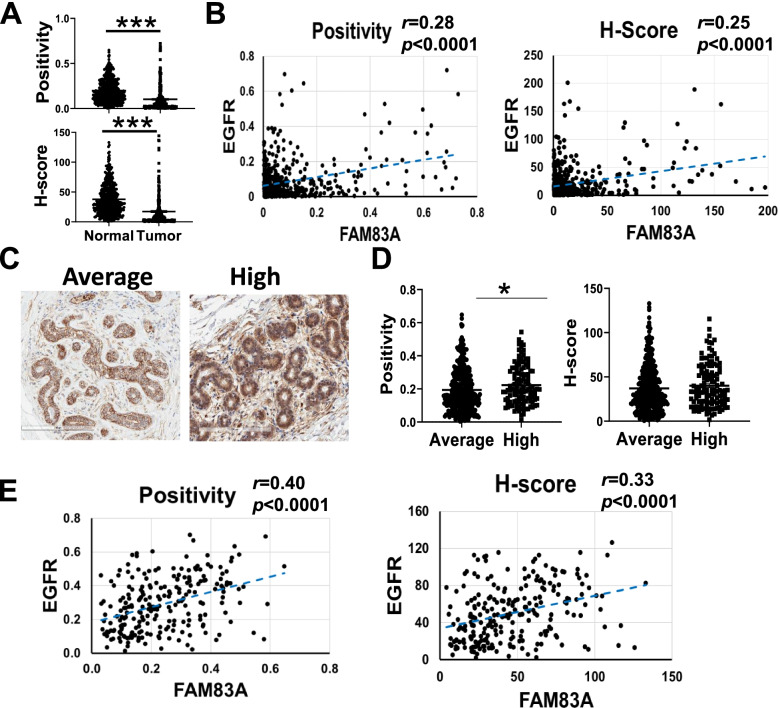
Fig. 3.
EGFR and FAM83A correlation in cancerous and normal breast. A EGFR staining quantification in normal breast (N) and Tumor (T) tissues. Staining quantification is expressed as positivity and H-score. Data are shown as mean ± standard error of the mean. B Pearson’s correlation between FAM83A and EGFR level in breast tumors. C Representative images of EGFR staining of normal breast tissues from women at either average or high risk for breast cancer. 20X magnification is shown. D Quantification of EGFR staining of normal breast expressed as positivity and H-score. E Pearson’s correlation between FAM83A and EGFR level in normal breast tissues. *p < 0.05, ***p < 0.0001

