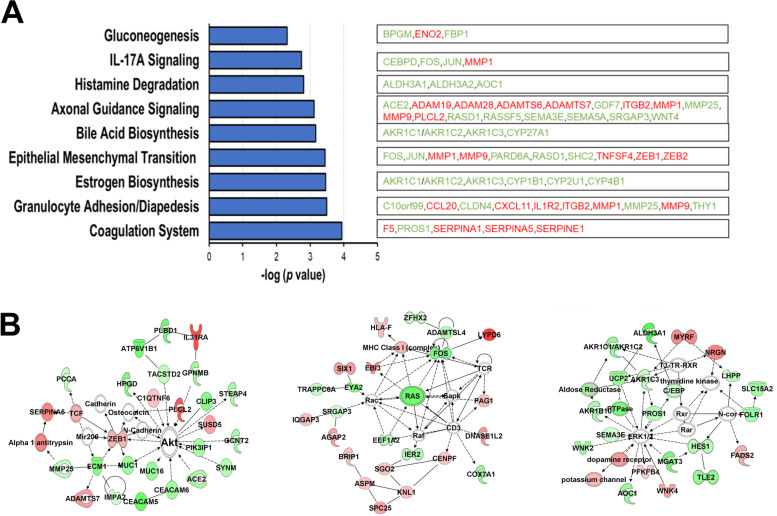
Fig. 5.
FAM83A overexpression induced metabolic pathway activation in primary epithelial cells. A Ingenuity pathway analysis (IPA) revealed the canonical pathways linked with the genes differentially expressed between FAM83A-overexpressing and control cells. Downregulated genes are in green and upregulated genes are in red. B Molecular networks linking the differentially expressed genes were obtained using IPA. Upregulated genes are shown in red while downregulated genes are in green and connecting molecules are white. The three networks shown in the figure include: Cancer and endocrine system disorders (left); Cancer and cell morphology (center); and Carbohydrate metabolism (right)

