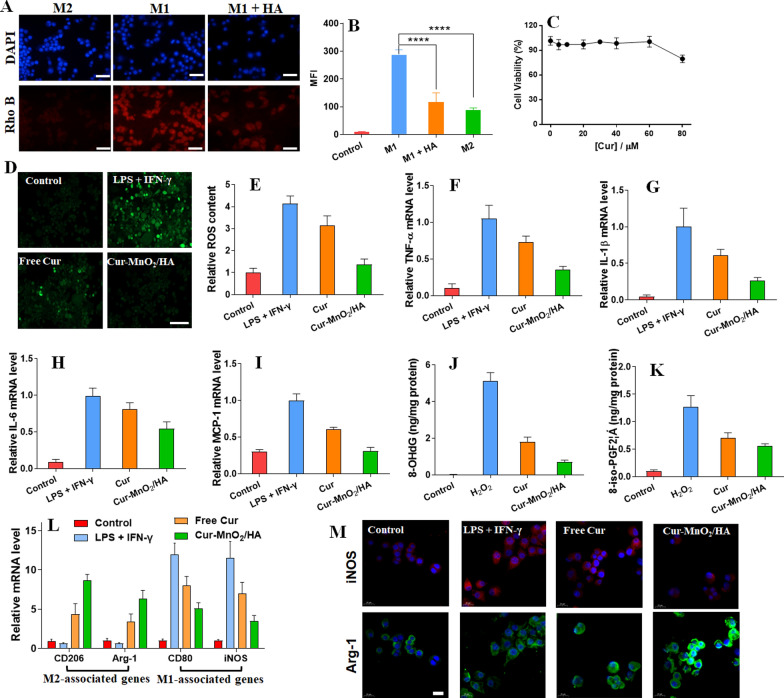
Fig. 2.
Cellular uptake and biological effects of Cur-MnO2/HA NPs in macrophages. A Fluorescent images and B flow cytometry analysis of Cur-MnO2/HA NPs uptake by M1/M2 macrophages for 4 h incubation. To compete CD44 binding, the cells were pretreated with 5 mg/mL free HA for 4 h. Scale bar = 50 μm. C Cell viability of the macrophages after incubating with different concentrations of Cur-MnO2/HA NPs for 24 h. D Fluorescent images and E fluorescent intensity quantified by flow cytometry to probe the ROS level (DCFH-DA probe) in macrophages stimulated by LPS + IFN-γ for 4 h, and further treatment with different formulations. Scale bar = 50 μm. The inflammatory cytokines of F TNF-α, G IL-1β, H IL-6, I MCP-1 secreted by RAW 264.7. The cells were pre-treated with medium or different formulations, followed by stimulation with IFN-γ + LPS for 24 h. Expression levels of J 8-OHdG and K 8-iso-PGF2α measured by ELISA. The cells were pre-treated with different formulations for 2 h, and then incubated with H2O2. L The relative expression of M1 and M2 associated genes in RAW 264.7 after different treatments. M Immunofluorescence staining of iNOS and Arg-1 in RAW 264.7 after different treatments. Scale bar = 20 μm

