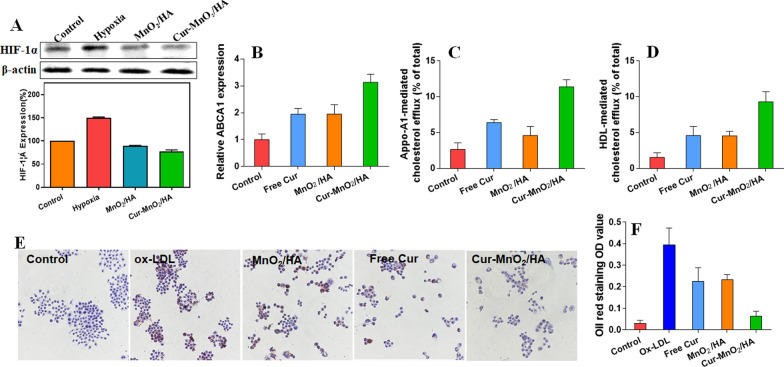
Fig. 3.
A Western blot analysis the expression of HIF-1α protein in macrophages with different treatments, and the quantified results. B Relative expression of ABCA1 mRNA after different treatments. NBD-cholesterol-loaded macrophages treated with different formulations to evaluate their effects on C Apo-A1-mediated and D HDL-mediated cholesterol efflux. E Microscopic imaging showing the activity of different formation to inhibit ox-LDL-mediated foam cell formation in macrophages, and F the quantification of ORO staining in foam cells derived from macrophage after different treatments

