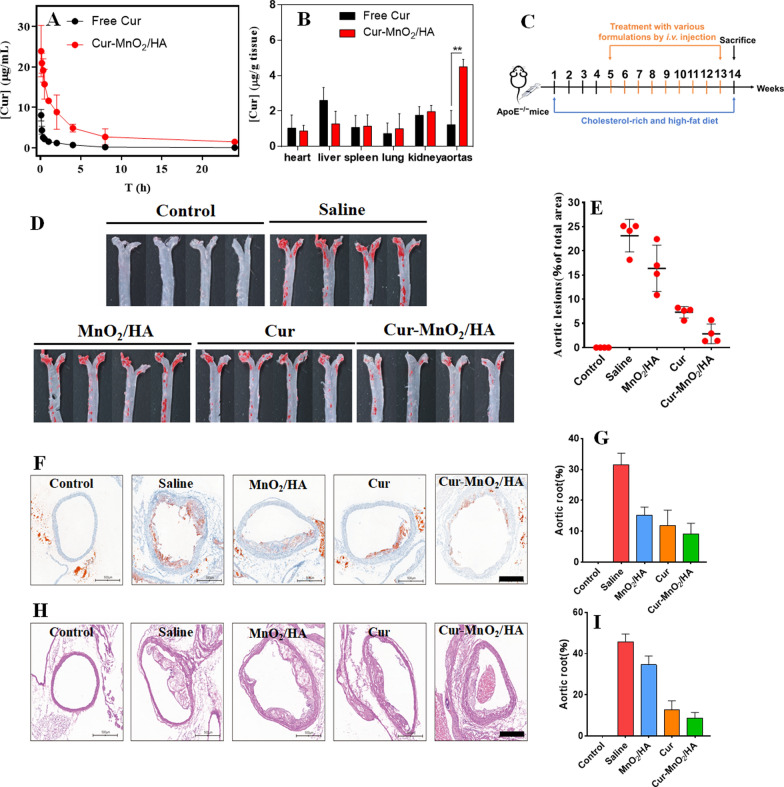
Fig. 4.
A Plasma Cur concentration versus time after intravenous injection of free Cur and Cur-MnO2/HA. B Biodistribution of Cur at 6 h post-injection of free Cur and Cur-MnO2/HA. C Schematic showing the treatment process of ApoE−/− mice with various formulations. D Representative photographs of ORO-stained aortas from mice after different treatments. E Quantification of the lesion area in aortas. F ORO-stained cryosections of the aortic root, and G the quantitative analysis. H Representative H&E images of aortic root sections, and I quantification of necrotic core area to plaque area. Scale bar, 500 μm

