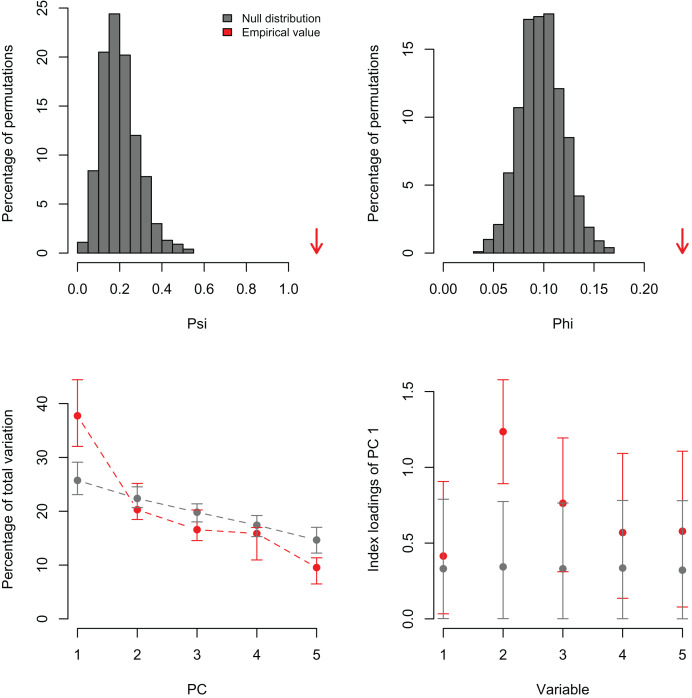
Figure 2. Null distributions and empirical statistics derived from PCAtest analysis of simulated data consisting of five correlated variables (r = 0.25) and 100 observations.
Lower plots show mean observed values (red dots), 95%-confidence interval (CI) based on 1,000 bootstrap replicates (red bars), mean values and 95%-CI based on 1,000 random permutations (gray dots and bars, respectively).

