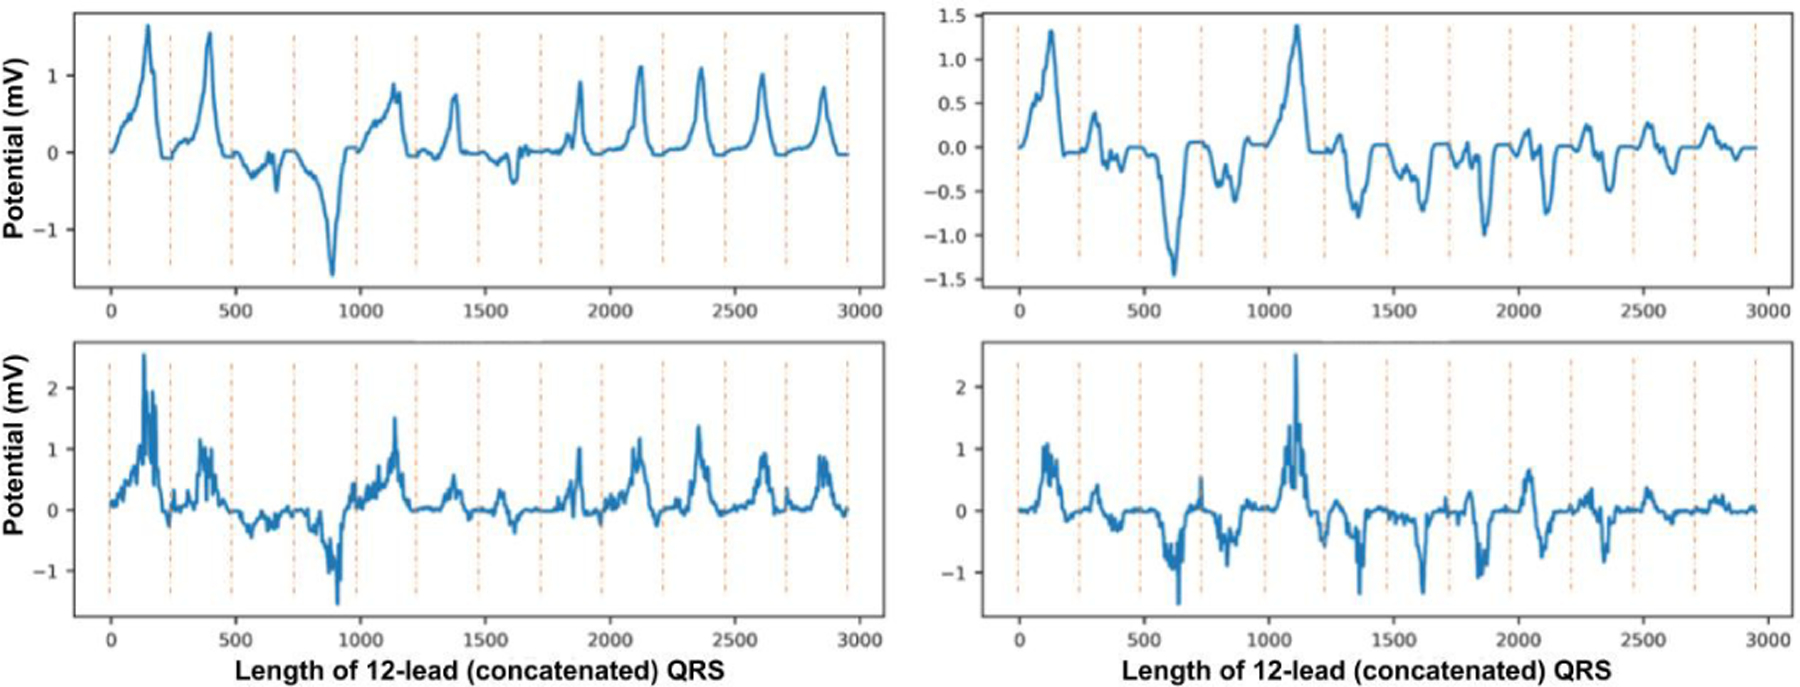
Fig. 6:

Reconstruction examples (bottom) for the consecutive two original samples (top) from SimECG data set. Note that the QRS signals from each lead are concatenated to form a single 1D signal. The vertical dotted lines demonstrate the separation of signals in each lead.
