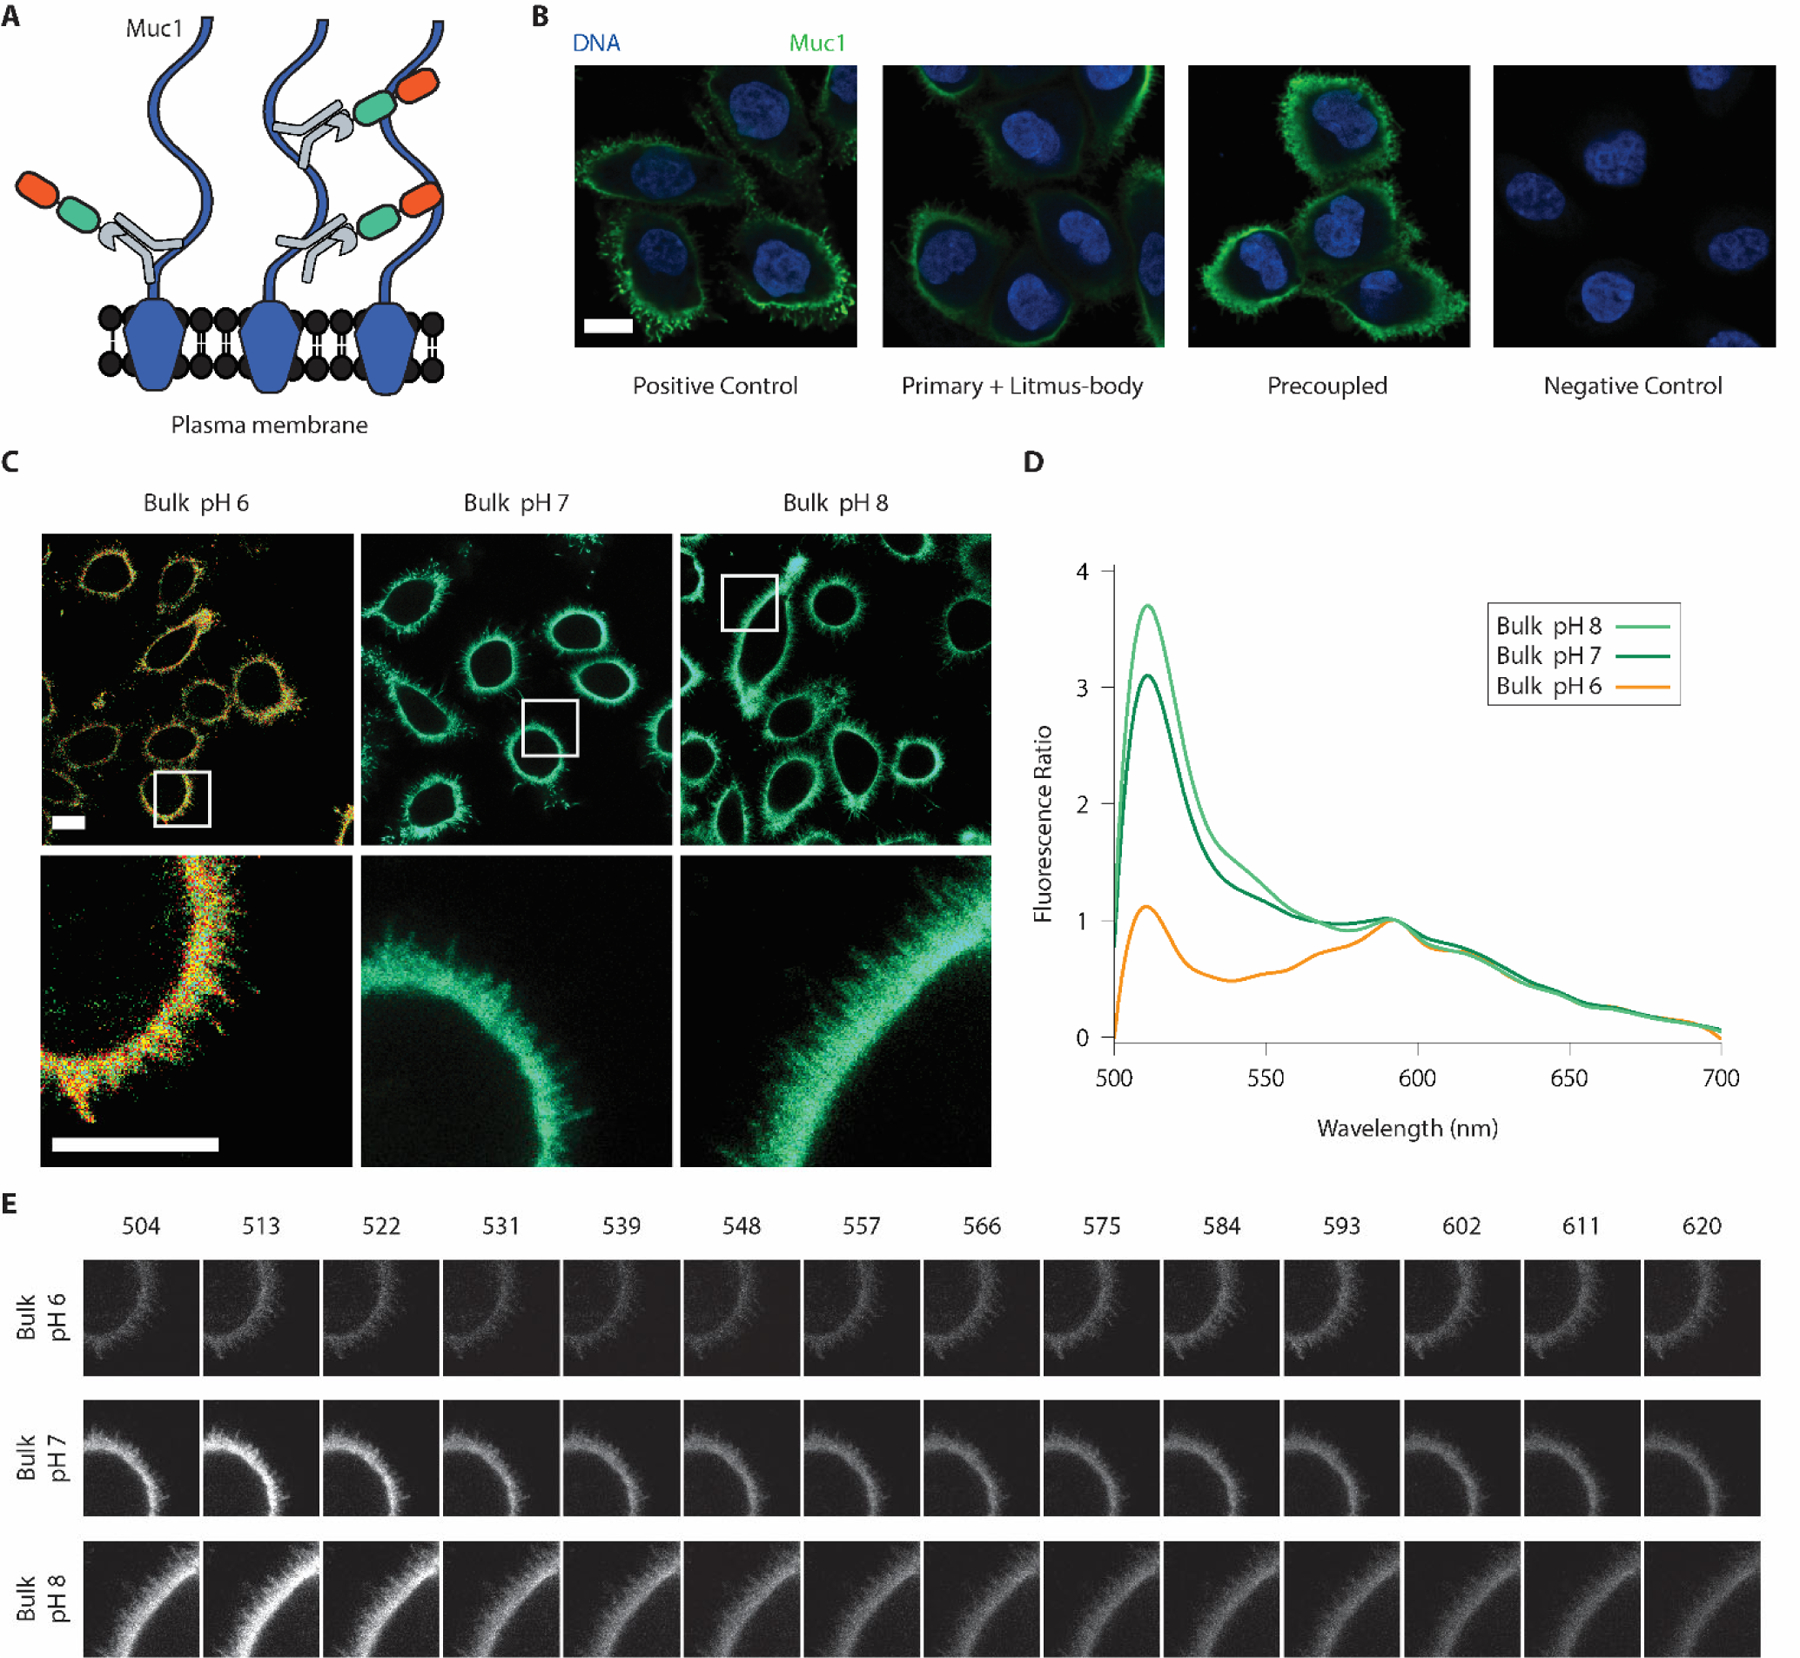
Figure 2.

Litmus-bodies bind specifically to their target of interest and respond to bulk pH change on live cells. A) Scheme depicting the nature of binding between Muc1, and pre-coupled anti-Muc1 IgG-Litmus-body on Muc1 overexpressing MCF10A cells. Numerous epitopes for anti-Muc1 IgG are present on the cell surface, allowing for dense labelling. B) Representative immunofluorescence images from three independent experiments depicting the specificity of the Litmus-body as compared against conventional secondary antibody staining (Blue: DNA, and Green: 488 nm excitation) on paraformaldehyde-fixed Muc1-overexpressing MCF10A cells. Positive control depicts treatment with an anti-Muc1 primary IgG and Alexa Fluor 488 anti-IgG secondary antibody. Cells were treated with an anti-Muc1 primary antibody and the Litmus-body was used as a secondary reagent (Primary + Litmus-body). To test for a simple, one-step staining procedure, anti-Muc1 IgG antibody was pre-reacted with the Litmus-body to form an anti-Muc1 IgG-Litmus-body complex before applying to cells (Precoupled). C) Representative live cell images from three independent experiments of pre-coupled anti-Muc1 IgG-Litmus-body binding to Muc1 overexpressing MCF10A cells treated with 0.1% (w/v) sodium azide in various bulk pHs. The bottom row depicts select regions of interest (white boxes). D) Fluorescence spectra normalized against the mCyRFP1 emission (calculated as (intensity/intensity at 593 nm)), from the region of interest presented in C). E) Spectral stacks of the three regions of interests depicted in C), with the wavelengths listed in nm. Panels for each sample were normalized against their mean intensity at 593 nm. Scale bars: 10 μm.
