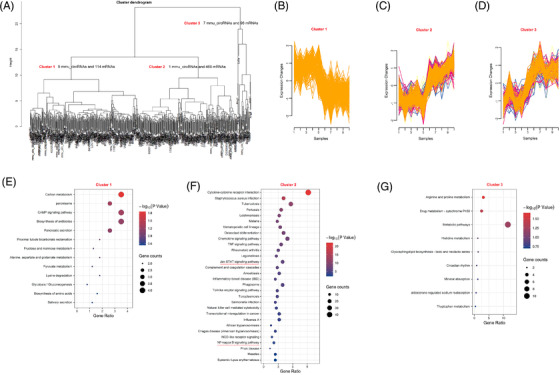
FIGURE 4.

The K‐means clustering algorithm divided the differentially expressed circRNAs and mRNAs of colitis into three subgroups. (A) The scheme for K‐means clustering algorithm in the mouse colitis. (B–D) Cluster 1–3 with similar expression patterns were defined. (E–G) The KEGG analyses from differentially expressed mRNAs in clusters 1–3 were described
