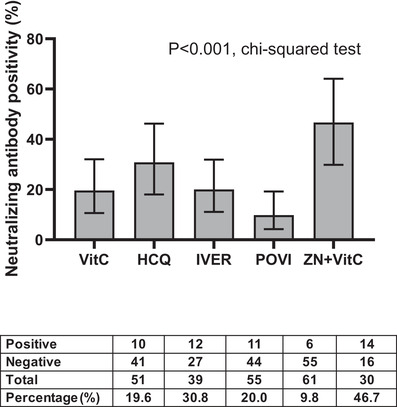
FIGURE 2.

Comparison in proportion of participants who developed neutralising antibodies by day 42 according to intervention. Bar graphs (error bars) denote median values with 95% confidence intervals. The 95% confidence intervals of proportion were estimated using a one‐sample proportion test with a hypothesised value of 0.5. p‐Value was derived chi‐squared test. The table below the figure indicate the number of participants with positive and negative neutralising antibodies, number of participants in each intervention without neutralising antibodies at baseline, and percentage conversion in neutralising antibodies (%). Abbreviations: VitC, vitamin C; HCQ, hydroxychloroquine; POVI, povidone‐iodine; IVER, ivermectin; ZN, zinc
