FIGURE 1.

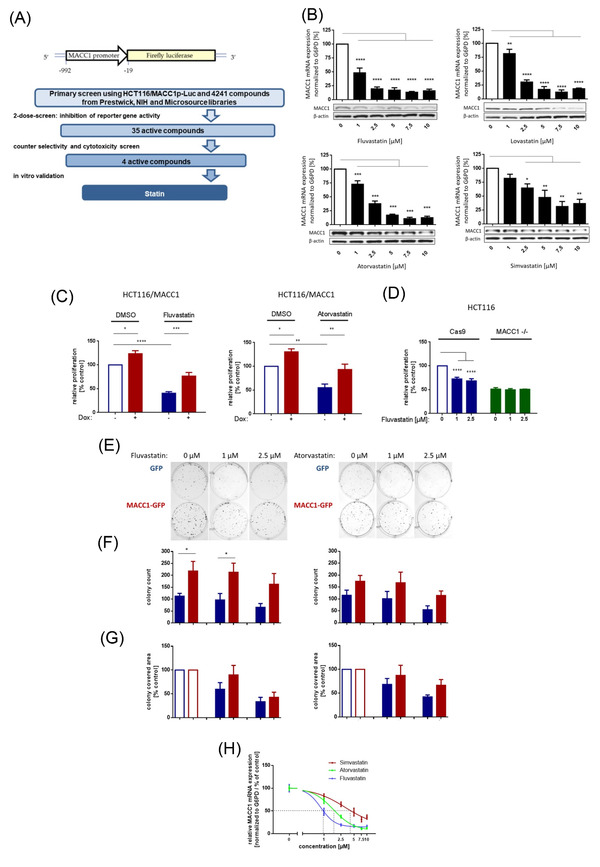
Statins reduce metastasis‐associated in colon cancer 1 (MACC1) expression and specifically inhibit MACC1‐mediated functions in vitro. This schematic presentation (A) illustrates the vector expressed in HCT116/ MACC1p‐Luc cells that were employed in our high‐throughput drug screen (HTS). The luciferase reporter gene is controlled by the MACC1 promoter (MACC1p). A tiered process revealed fluvastatin as a transcriptional inhibitor of MACC1, with a total of 4241 compounds tested. The initial two‐dose screening was followed by cytotoxicity and selectivity (with HCT116/CMVp‐Luc cells) assessment as well as in vitro validation. Dose‐dependent reduction of MACC1 messenger RNA (mRNA) and protein expression in HCT116 cells by different statins (fluvastatin, atorvastatin, lovastatin, simvastatin) is shown in (B). MACC1 mRNA levels were normalized to G6PD mRNA expression and respective treatment controls (dimethyl sulfoxide [DMSO], indicated with white bars). Results for mRNA represent the means ± standard error of the mean (SEM) of three independent experiments; for Western blot, one representative example of at least two independent experiments is shown. In the Western blot, β‐actin or vinculin served as loading controls. Significant results were determined by one‐way analysis of variance (ANOVA) and Dunnett's multiple comparison test with a 95% CI (* = p < .05, ** = p < .01, *** = p < .001, **** = p < .0001). Relative proliferation (C) was determined with the IncuCyte live imaging system for 72 h and calculated by the area under the curve (AUC), normalized to untreated controls (white bars). HCT116 cells with doxycycline‐induced MACC1 expression (+Dox) demonstrated a 30% increase in proliferation. MACC1‐induced proliferation in +Dox compared to ‐Dox cells was still observed under statin treatment, indicating a MACC1‐specific rescue of proliferative function (C); our previous findings were confirmed using HCT116/MACC1 ‐/‐. MACC1 knock‐out resulted in a >50% reduction in proliferation versus control cells (HCT116/Cas9). Control cell proliferation was decreased by fluvastatin treatment (1 and 2.5 μM), whereas HCT116/MACC1 ‐/‐ cells remained unaffected (D). Stable overexpression of MACC1‐GFP in HCT116 led to strongly augmented colony formation compared to HCT116/GFP cells. The same effect was seen under statin treatment, indicating a MACC1‐specific rescue of clonogenic function (E). Clonogenicity was quantified by the number of colonies (F) and colony covered area (G). Results represent means + SEM of at least three independent experiments, presented as total counts (F) or normalized to solvent treated controls (white bars, G). For the clonogenic assay, one representative of nine technical replicates of three independent experiments is shown. Significant results were determined by one‐way or two‐way ANOVA and Sidak's multiple comparison test with a confidence interval of 95% (* = p < .05, ** = p < .01, *** = p < .001, **** = p < .0001). Panel (H) shows the relative MACC1 mRNA expression presented as drug‐response curves for IC50 determination. Fluvastatin (IC50: 0.8457 μM) is able to reduce MACC1 mRNA expression at lower doses as atorvastatin (IC50: 1.647 μM) and simvastatin (IC50: 3.098 μM)
