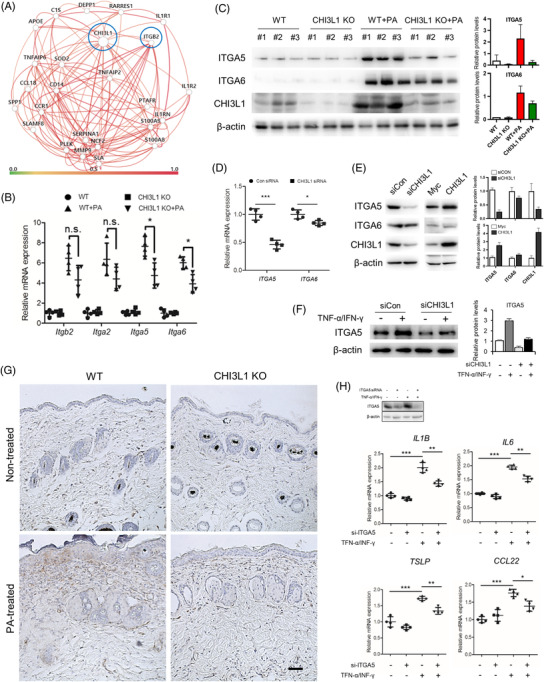
FIGURE 2.

Chitinase 3‐like protein 1 (CHI3L1) regulates ITGA5 expression. (A) The gene‐network map of CHI3L1 and its predicted gene interactions. (B) mRNA expression of Itgb2, Itga2, Itga5 and Itga6 in animal model skin tissues determined by quantitative PCR (qPCR). n = 4. (C) Expression of ITGA5, ITGA6 and CHI3L1 in phthalic anhydride (PA)‐induced skin tissues detected by Western blot analysis. n = 3. (D) HaCaT cells were transfected with human CHI3L1 siRNA (20 nM) for 24 h. mRNA expression of ITGA5 and ITGA6 was determined using qPCR. n = 4. (E) Expression of ITGA5 and ITGA6 in CHI3L1 knockdown or CHI3L1‐overexpressing HaCaT cells detected by Western blot analysis. (F) HaCaT cells were transfected with CHI3L1 siRNA (20 nM). After 24 h, the cells were treated with tumour necrosis factor (TNF)‐α and interferon (IFN)‐γ (20 ng/ml) for 4 h. Expression of ITGA5 was analysed by Western blot analysis. (G) Expression of ITGA5 in PA‐induced skin tissues detected using immunohistochemistry. Scale bar, 50 μm. (H) HaCaT cells were transfected with human ITGA5 siRNA (20 nM). After 24 h, the cells were treated with tumour necrosis factor (TNF)‐α and IFN‐γ (20 ng/ml) for 4 h. Knockdown efficiency was determined by Western blot analysis, and mRNA expression of interleukin (IL)1B, IL6, thymic stromal lymphoprotein (TSLP) and CCL22 was determined using qPCR. n = 4. Data are expressed as the mean ± SD. *p < .05, **p < .01 and ***p < .001
