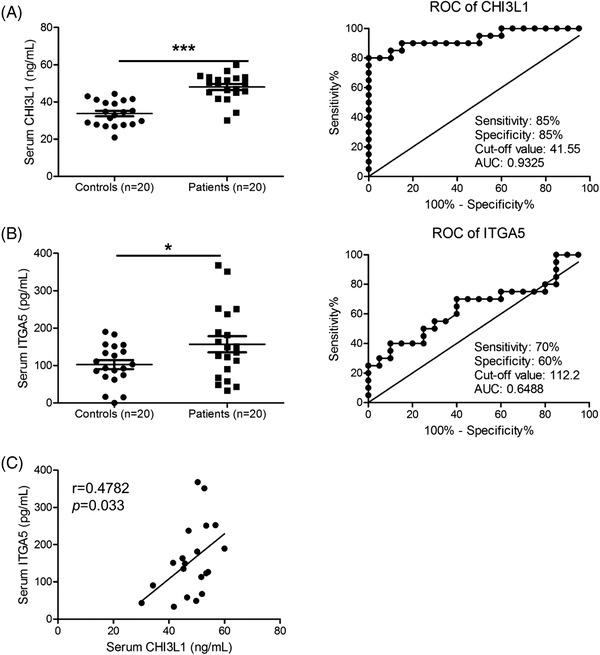
FIGURE 4.

Clinical relationship between Chi3L1 and ITGA5 in patients with atopic dermatitis (AD). (A and B) Serum levels and receiver operating characteristic curve of chitinase 3‐like protein 1 (CHI3L1) (A) and ITGA5 (B) in patients with AD and healthy controls. n = 20. (C) Correlation between CHI3L1 and ITGA5. R value indicates Spearman's correlation co‐efficient. Data are expressed as the mean ± SD. *p < .05, and ***p < .001
