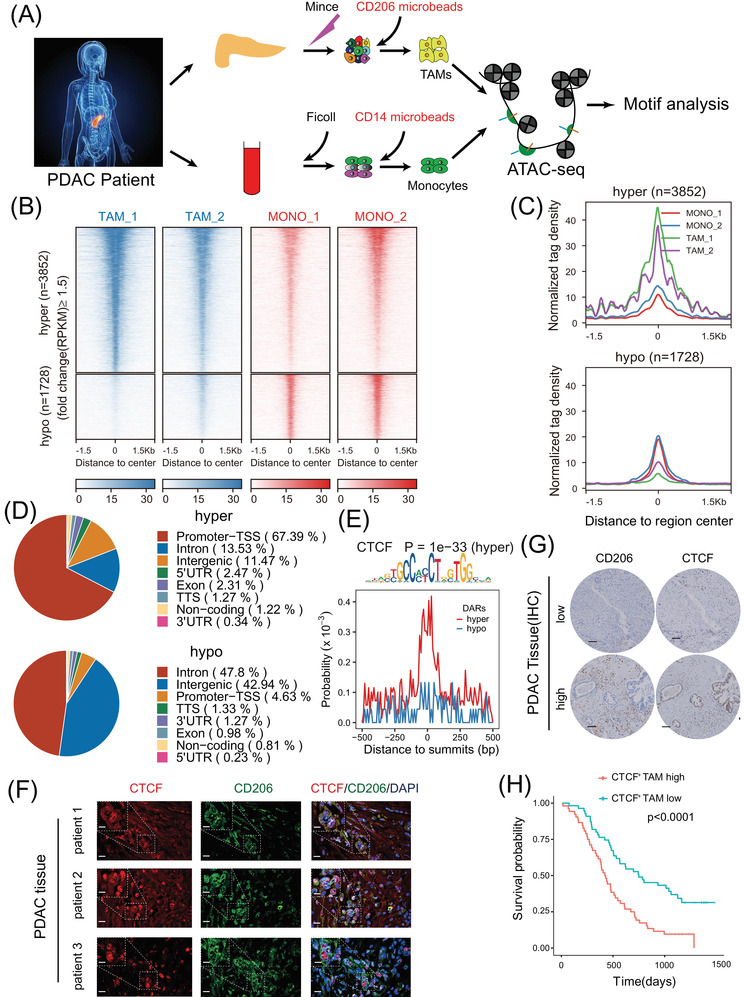
FIGURE 1.

Assay for transposase‐accessible chromatin with sequencing (ATAC‐seq) reveals CCCTC‐binding factor (CTCF) as a key transcription factor in tumour‐associated macrophages (TAMs) (A) Schematic illustration of ATAC‐seq two sample preparation (n = 2). Tumour‐associated macrophages (TAMs) from two pancreatic ductal adenocarcinoma (PDAC) tissue samples were enriched with CD206 positive selection. Monocytes (MONO) from blood samples of the same patient were enriched with CD14 positive selection. (B) Heatmap showing normalised ATAC‐seq signals (RPKM) in TAMs and monocytes (MONO) over differentially accessible regions (DARs). The top set of panels shows read signals over the 3852 hyper‐accessible regions, while the bottom set of panels shows read signals over the 1728 hypo‐accessible regions in TAMs. Signals within 1.5 kb surrounding the centre of DARs are displayed in descending order. (C) Profiles of normalised tag density across a genomic window of ±1.5 kb surrounding the centre of hyper‐ and hypo‐accessible regions. (D) Pie‐chart showing the proportion of hyper‐ and hypo‐accessible sites within the indicated genomic regions: exons, intergenic regions, introns, 3′ UTR, 5′ UTR, promoters‐transcription start site (TSS), TES and noncoding regions. Peak summits located up to 1 kb upstream and 100 bp downstream of the TSS were determined to be promoter‐TSS regions. (E) Distribution probability of CTCF binding motifs around ATAC‐seq peak summits in DARs. The p‐value was calculated by HOMER for the CTCF motif enriched in hyper‐accessible regions. (F) Colocalisation of CTCF (red) and CD206 (green) in three clinical samples of pancreatic ductal adenocarcinoma (PDAC) as shown by fluorescence microscopy. DAPI staining (blue) shows the nuclei (DNA). Scar bar: up panel, 15 μm; down the panel, 50 μm. (G) Representative IHC images of serial PDAC tissues stained for CD206 and CTCF. The 110 PDAC patients were divided equally into two groups (“low” and “high”) based on the median percentage of CTCF+ TAM infiltration in the tumour microenvironment. Scar bar: 200 μm. (H) Kaplan‐Meier survival curve presenting the overall survival of 110 PDAC patients, grouped according to the extent of CTCF+ TAM infiltration
