
FIGURE 3.
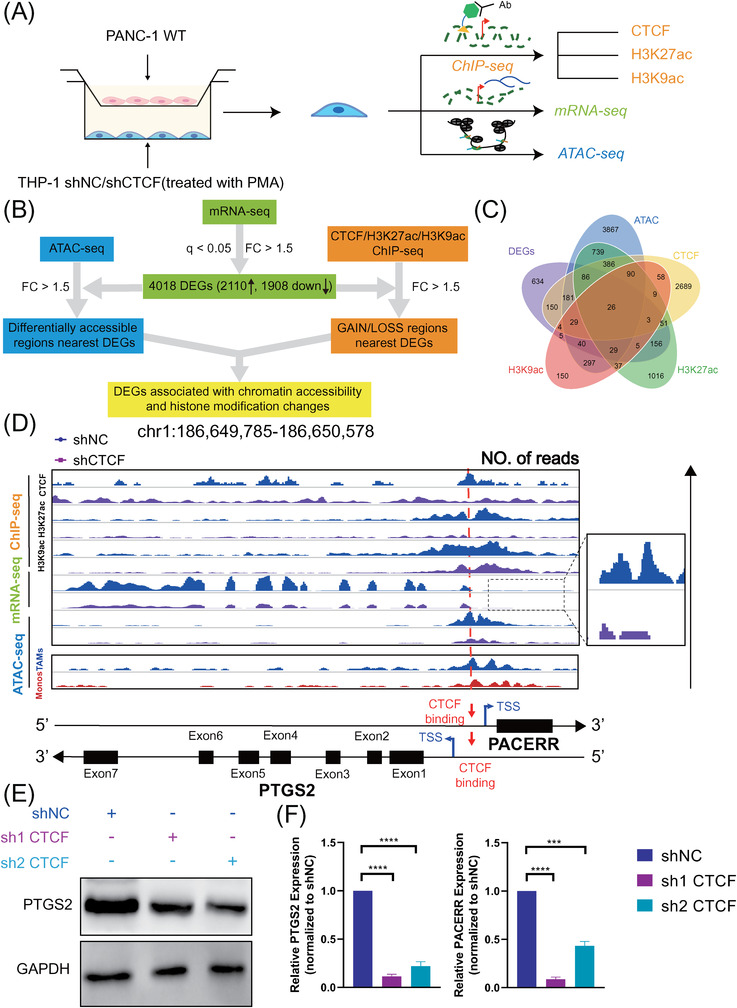
Integrative multi‐omics analysis and experimental validation reveal that prostaglandin‐endoperoxide synthase 2 (PTGS2) and PTGS2 antisense NF‐κB1 complex‐mediated expression regulator RNA (PACERR) are downstream targets of CCCTC‐binding factor (CTCF) in THP‐1‐derived tumour‐associated macrophages (TAMs). (A) Graphical scheme describing the workflow of performing RNA‐seq, ChIP‐seq and ATAC‐seq on control and CTCF‐knockdown THP‐1‐derived TAMs (THP‐1 stimulated with PMA and co‐cultured with PANC‐1). (B) Graphical scheme describing the workflow of comparing the transcriptome and epigenome between control and CTCF‐knockdown THP‐1‐derived TAMs (THP‐1 stimulated with phorbol 12‐myristate 13‐acetate [PMA] and co‐cultured with PANC‐1). (C) Venn diagram of the differentially expressed genes (DEG) results. (D) Genome browser snapshots of ChIP‐seq/mRNA‐seq/ATAC‐seq signals for the genomic regions near PTGS2 and PACERR in THP‐1‐derived TAMs (shNC/ shCTCF THP‐1 stimulated with PMA and co‐cultured with PANC‐1). shNC means that cells were transfected in negative control plasmids. ATAC‐seq signals of TAMs and monocytes (MONO) from pancreatic ductal adenocarcinoma (PDAC) clinical samples were also visualised. (E) PTGS2 protein expression in THP‐1‐derived TAMs (shNC and shCTCF THP‐1 stimulated with PMA and co‐cultured with PANC‐1), examined by Western blot. (F) PTGS2 and PACERR mRNA expression in THP‐1‐derived TAMs (shNC and shCTCF THP‐1 stimulated with PMA and co‐cultured with PANC‐1), examined by qPCR analysis. Data are shown as the results from three independent experiments. The image is representative of three independent experiments. * p < .05; ** p < .01; *** p < .001; **** p < .0001. Abbreviations: DEG: differentially expressed genes; FC: fold change, q: q‐value