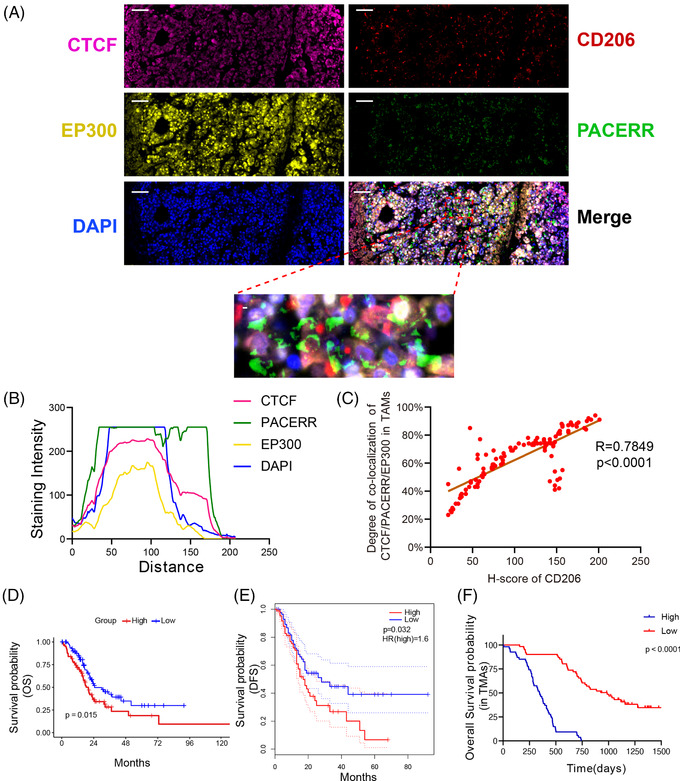
FIGURE 8.

The relationship among CCCTC‐binding factor (CTCF), PTGS2 antisense NF‐κB1 complex‐mediated expression regulator RNA (PACERR) and E1A binding protein p300 (EP300) in tumour‐associated macrophages (TAMs) and prediction values of CTCF, PACERR and EP300 in pancreatic ductal adenocarcinoma (PDAC). (A) The immunofluorescence and fluorescence in situ hybridisation (FISH) analysis of CTCF (pink), EP300 (yellow), CD206 (red), PACERR (green) and DAPI (blue) in PDAC tissues. Scar bar: 20μm. (B) Staining intensity of CTCF, PACERR, EP300 and DAPI on the immunofluorescence from TAMs of 110 PDAC patients. Pink represents CTCF. Green represents PACERR. Yellow represents EP300. Blue represents DAPI. (C) The Spearman correlation between the expression of CD206 and the degree of co‐localisation of CTCF, PACERR and EP300. The rates of the triple‐positive (CTCF+‐PACERR+‐EP300+) in TAMs were used to evaluate the degree of colocalisation of CTCF, PACERR and EP300. (D) and (E) PAAD patients from TCGA were divided into high group and low group based on the median expression of the multi‐signature of CTCF, PACERR and EP300. Kaplan‐Meier curves analysis of the overall survival (OS) (D) and disease‐free survival (E) between two groups. (F) 110 PDAC patients were divided into high group and low group based on the median of rates of triple‐positive cells in TAMs (the percentage of CTCF+‐PACERR+‐EP300+ TAMs number in total CD206 positive cells number). Kaplan‐Meier curves analysis of the overall survival (OS) between two groups
