
FIGURE 1.
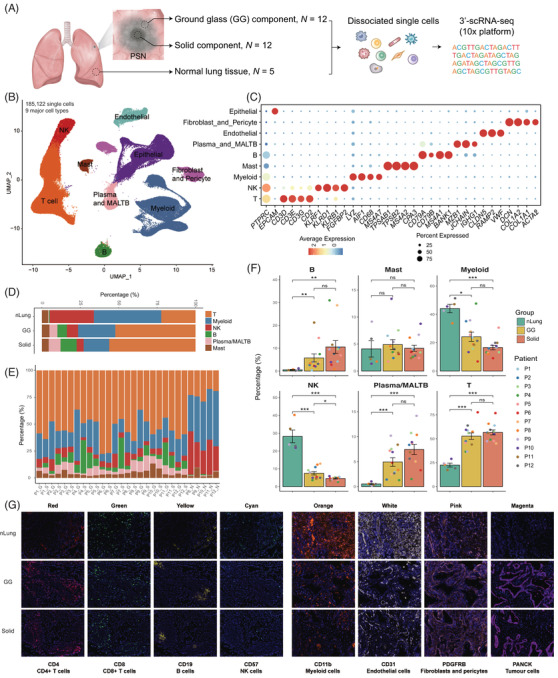
Study overview and dissection of the tumour microenvironment of the nLung tissues and the GG and solid components of PSNs using single‐cell RNA sequencing. (A) Schematic of the study design and sample information. (B) UMAP plot of 185,122 single cells coloured according to the nine major cell types. Cells were collected from nLung (n = 5), GG component (n = 12), and paired solid component (n = 12) samples. (C) Dot plot of expression of canonical marker genes for the nine major cell types. The dot size is proportional to the fraction of cells expressing the specific genes. The colour intensity corresponds to the relative expression of each specific gene. (D) Bar plot of the relative percentages of immune cell types across the three clinical groups. (E) Bar plot of the relative percentages of immune cell types across all samples. (F) Bar plots of the percentages of the six immune cell types among the three groups. Y‐axis: average percentage of samples across the three groups. Groups are shown in different colours. The error bars represent each group's ± standard error of the mean. The two‐sided unpaired Wilcoxon rank sum test was used for analysis. Multiple‐testing adjustment was performed using the Benjamini–Hochberg method. *P < 0.05; **P < 0.01; ***P < 0.001. GG, ground‐glass; nLung, normal lung; ns: not significant; PSN, part‐solid nodule; UMAP, uniform manifold approximation and projection. (G) Immunohistochemistry staining showing the cellular components of nLung, GG, and solid components