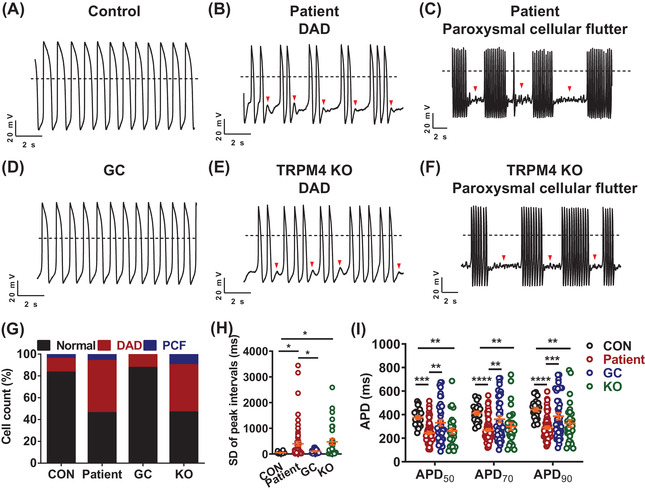
FIGURE 1.

TRPM4 T262M leads to cardiac arrhythmias in iPSC‐CMs. (A–F) Representative action potential tracings recorded by single‐cell patch clamp from control, patient, gene‐corrected (GC) and TRPM4 knockout (KO) ventricular‐like myocytes. Dashed lines indicate 0 mV. (G) Bar graph to compare the percentage of cells with arrhythmias between control (CON), patient, GC and KO iPSC‐CMs. Control: 16.7%; Patient: 53.8%; GC: 12.5%; KO: 53.3%. n = 24–65 in two lines. (H) Scatter dot plot to compare SD of peak intervals between control, patient, GC and KO iPSC‐CMs by one‐way analysis of variance (ANOVA) (Tukey method). n = 24–65 in two lines. * p < .05. (I) Scatter dot plot to compare action potential durations (APDs) between control, patient, GC and KO iPSC‐CMs by two‐way ANOVA (Tukey method). n = 24–65 in two lines. ** p < .01, *** p < .001 and **** p < .0001
