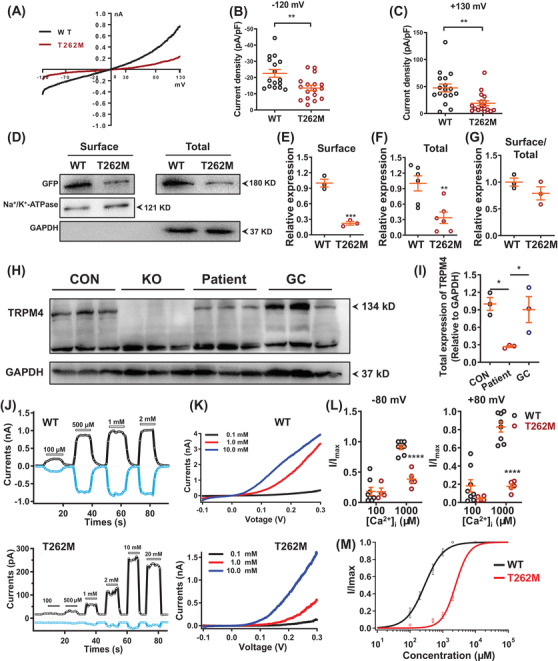
FIGURE 2.

T262M confers impaired TRPM4 channel function. (A) Current‐voltage curves (IV curves) of whole‐cell TRPM4 currents recorded from human embryonic kidney 293T cells (HEK293T cells) overexpressing WT and T262M channels labelled with green fluorescent protein (GFP) at C terminus. Successfully transfected cells, indicated by green fluorescence, were patch‐clamp recorded for macroscopic currents using a voltage ramp protocol for 250 ms from –120 mV to +130 mV. (B, C) Scatter dot plots to compare the peak TRPM4 current density at ‐120 mV and +130 mV between WT and T262M by unpaired two‐tailed Student's t‐test (at –120 mV: WT = 22.6 ± 2.4 pA/pF, T262M = 13.5 ± 1.7 pA/pF; at +130 mV: WT = 47.4 ± 7.3 pA/pF, T262M = 19.1 ± 4.5 pA/pF). n = 16–17 patches. ** p < .01. (D) Western blot analysis of surface and total protein expression of TRPM4 in HEK293T cells overexpressing WT and T262M. (E–G) Scatter dot plots to compare the surface expression of TRPM4, total expression of TRPM4, and TRPM4 surface expression/TRPM4 total expression (surface/total) between WT and T262M by unpaired two‐tailed Student's t‐test, respectively. n = 3–6 independent experiments. ** p < .01 and *** p < .001. (H) Western blot analysis of total protein expression of TRPM4 in control, KO, patient and GC iPSC‐CMs. (I) Scatter dot plot to compare total protein expression of TRPM4 in control, patient and GC iPSC‐CMs by one‐way analysis of variance (ANOVA) (Tukey method). n = 3 independent experiments. * p < .05. (J) Representative TRPM4 current tracings of WT and T262M by inside‐out patch‐clamp recordings at +80 mV (black) and –80 mV (blue). (K) Representative IV curves of TRPM4 currents in WT and T262M by inside‐out patch clamp recordings. Three different Ca2+ concentrations were used including 0.1, 1.0 and 10.0 mM. In WT channels, currents were robustly obtained at 100 μM [Ca2+]i and the [Ca2+]i‐activated currents saturated when the [Ca2+]i concentration reached 500 μM. In contrast, T262M channels gave rise to detectable currents upon perfusion of 500 μM [Ca2+]i, which appeared significantly larger at 1000 μM [Ca2+]i and saturated at 10000 μM [Ca2+]i. (L) Currents normalized to the response to 100 and 1000 μM Ca2+ at –80 mV or +80 mV as in the experiments in Figure 2J by two‐way ANOVA (Tukey method). n = 4–8 patches. **** p < .0001. (M) The concentration‐response curves of WT and mutant T262M with Ca2+ concentrations were measured with inside‐out patch‐clamp recordings. n = 3–5 patches
