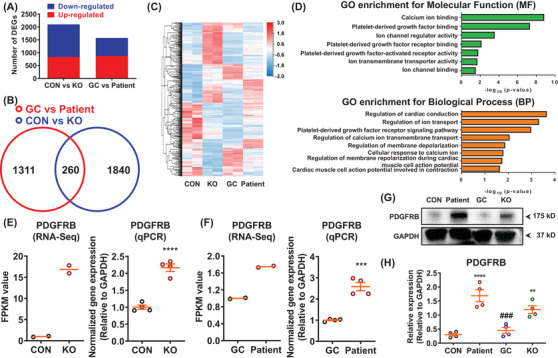
FIGURE 3.

RNA sequencing analysis reveals abnormal activation of platelet‐derived growth factor signalling in patient iPSC‐CMs. (A) Bar graph to compare the number of differentially expressed genes (DEGs) between control and KO, as well as GC and patient iPSC‐CMs. n = 2 independent samples. (B) Venn diagram to compare DEGs between control and KO, as well as GC and patient iPSC‐CMs. (C) Heatmap demonstrating the differential gene expression pattern between control and KO, as well as GC and patient iPSC‐CMs. By one set of RNA sequencing (RNA‐Seq) analysis using samples of GC and patient iPSC‐CMs (GC vs. patient), we observed that 1573 genes out of 18 805 total genes were differentially expressed in GC iPSC‐CMs (869 up‐regulated and 704 down‐regulated) as compared to patient iPSC‐CMs. By another set of RNA‐Seq analyses using samples of control and TRPM4 KO iPSC‐CMs (CON versus KO), 2100 DEGs were found in control iPSC‐CMs (834 up‐regulated and 1266 down‐regulated), when compared to KO iPSC‐CMs. A cross‐analysis of GC versus patient and CON versus KO identified 260 common DEGs, in which 95 genes were up‐regulated and 165 genes were down‐regulated, respectively. (D) Enriched gene ontology (GO) for molecular function (MF) and biological process (BP). DEGs were enriched in platelet‐derived growth factor (PDGF) signaling, including “PDGF binding”, “PDGF receptor binding”, “PDGF‐activated factor activity” and “PDGF receptor signaling pathway”. (E) Scatter dot plots to compare the mRNA expression of PDGFRB between control and KO iPSC‐CMs by RNA‐Seq (n = 2 independent samples) and qPCR (n = 4 independent experiments) by unpaired two‐tailed Student's t‐test. **** p < .0001. (F) Scatter dot plots to compare the mRNA expression of PDGFRB between GC and patient iPSC‐CMs by RNA‐Seq (n = 2 independent samples) and qPCR (n = 4 independent experiments) by unpaired two‐tailed Student's t‐test. *** p < .001. (G) Western blot analysis of total protein expression of PDGFRB in control, patient, GC and KO iPSC‐CMs. (H) Scatter dot plot to compare total protein expression of PDGFRB in different groups by one‐way analysis of variance (ANOVA) (Tukey method). n = 4 independent experiments. ** p < .01 and **** p < .0001, when compared to control iPSC‐CMs; ### p < .001 when compared to patient iPSC‐CMs
