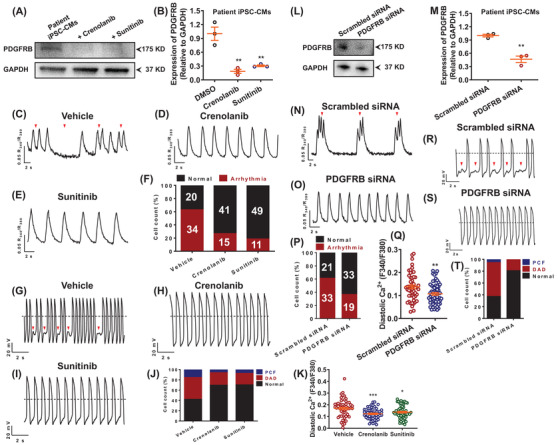
FIGURE 4.

Restoration of diastolic [Ca2+]i and rescue of arrhythmic phenotypes by inhibition of PDGFRB signalling. (A) Western blot analysis of total protein expression of PDGFRB in patient iPSC‐CMs treated with dimethyl sulfoxide (DMSO) and two PDGFRB inhibitors (crenolanib and sunitinib). (B) Scatter dot plot to compare total protein expression of PDGFRB in different groups by unpaired two‐tailed Student's t‐test. n = 3 independent experiments. ** p < .01. (C–E) Representative Ca2+ transient tracings from patient iPSC‐CMs treated with DMSO, crenolanib or sunitinib. (F) Bar graph to compare the percentage of cells exhibiting regular and irregular Ca2+ transient pattern between different groups. n = 54–60 in two lines. The proarrhythmic activities were greatly attenuated when treated with crenolanib or sunitinib as evidenced by Ca2+ imaging. (G–I) Representative action potential tracings from patient iPSC‐CMs treated with DMSO, crenolanib or sunitinib. (J) Bar graph to compare the percentage of cells with arrhythmias between patient iPSC‐CMs treated with DMSO, crenolanib and sunitinib. n = 26–33 in two lines. The proarrhythmic activities were greatly attenuated when treated with crenolanib or sunitinib as evidenced by patch clamp recordings. (K) Scatter dot plot to compare diastolic [Ca2+]i between different groups by unpaired two‐tailed Student's t‐test. The elevation of diastolic [Ca2+]i in myocytes carrying TRPM4 T262M was restored by crenolanib or sunitinib treatment. n = 54 in two lines. * p < .05 and *** p < .001. (L) Western blot analysis of total protein expression of PDGFRB in patient iPSC‐CMs treated with scrambled or PDGFRB siRNA. (M) Scatter dot plot to compare total protein expression of PDGFRB between the two groups by unpaired two‐tailed Student's t‐test. n = 3 independent experiments. ** p < .01. (N, O) Representative Ca2+ transient tracings from patient iPSC‐CMs treated with scrambled or PDGFRB siRNA. (P) Bar graph to compare the percentage of cells exhibiting regular and irregular Ca2+ transient patterns between the two groups. n = 52–54 in two lines. (Q) Scatter dot plot to compare diastolic [Ca2+]i between the two groups by unpaired two‐tailed Student's t‐test. n = 52–59 in two lines. ** p < .01. (R, S) Representative action potential tracings from patient iPSC‐CMs treated with scrambled or PDGFRB siRNA. (T) Bar graph to compare the percentage of cells with arrhythmias between patient iPSC‐CMs treated with scrambled and PDGFRB siRNA. n = 36 in two lines
