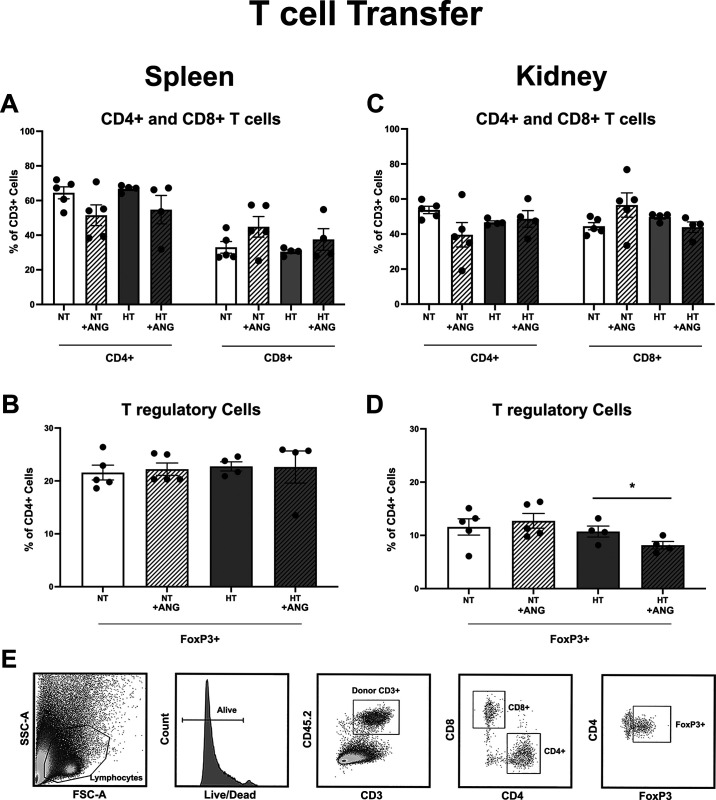
Figure 3.
Flow cytometric analysis of splenic and renal T cells in Rag-1−/− females following normotensive T cell (NT) or hypertensive T cell (HT) transfer and angiotensin II (ANG II) infusion. No significant difference was found in the frequency of CD4+ or CD8+ splenic T cells (A) or in the frequency of FoxP3+ splenic T regulatory cells (B) regardless of donor T cell activation (NT vs. HT) or ANG II infusion (control vs. control + ANG). Similarly, no significant difference was found in the frequency of CD4+ or CD8+ renal T cells (C) regardless of donor T cell activation (NT vs. HT) or ANG II infusion (control vs. ANG). However, females that received hypertensive T cells (HT + ANG) had a significantly lower frequency of renal FoxP3+ T regulatory cells compared with the respective control (HT control) and compared with females that received NT before ANG II infusion (NT + ANG) (D). E: representative flow cytometric gating. n = 5 in the NT groups and n = 4 in the HT groups. *P ≤ 0.05 via two-way ANOVA with a Tukey multiple comparison test. Rag-1, recombination-activating gene-1; FSC-A, forward scatter area; SSC-A, side scatter area.

