Figure 6.
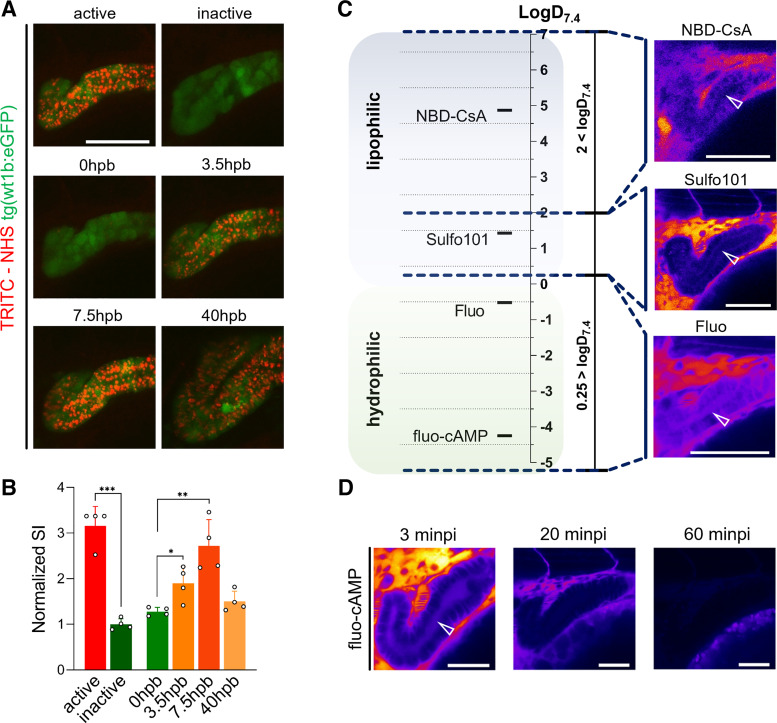
Endocytosis of protein-bound TRITC-NHS in the proximal convoluted tubule (PCT) and luminal secretion of hydro- and lipophilic fluorescent substrates. A: top: “active” indicates the PCT signal of a chemical reactive fluorescent compound (TRITC-NHS) 3 h postinjection (hpi); “inactive” indicates TRITC-NHS injected after inactivation by hydrolysis. A, middle and bottom: photobleaching of the PCT after injection of active TRITC-NHS and shown after 3.5, 7.5, and 40 h postbleaching (hpb). The green signal indicates 80-h postfertilization (hpf) tg(wt1b:eGFP) ZFL. Scale bar = 50 µm. B: quantitative assessment of TRITC-associated signals within the PCT (green) shown in A. Normalized SI is the PCT signal intensity compared with inactive TRITC-NHS. C: fluorescent substrates of proximal tubular drug transporters were categorized by lipophilicity (logD7.4 < 0.25 and logD7.4 > 2). Representative lateral projections of 72 hpf ZFL are shown to provide an alignment of hydrophilic/lipophilic classifications and the corresponding tubular signals. The white arrow indicates the tubular lumen. Scale bars = 50 µm. D: time-dependent depletion of the fluo-cAMP signal in the lumen of the PCT. Minpi, minutes postinjection. Scale bars = 30 µm. Values are means ± SD; n = 4. *P < 0.02; **P < 0.002; ***P < 0.0001.

