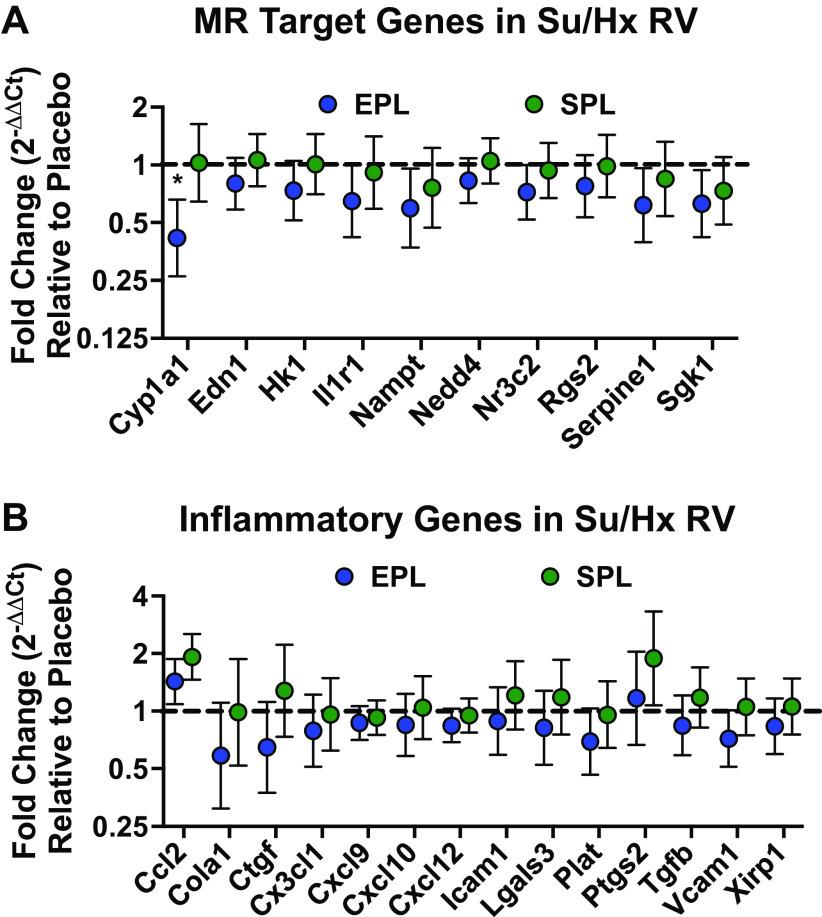
Figure 8.
Right ventricular (RV) mineralocorticoid receptor (MR) and inflammatory target gene transcription was suppressed by eplerenone (EPL) treatment. A: EPL consistently suppressed RV MR target gene induction, although only the reduction of Cyp1a1 reached statistical significance (P = 0.04). Although directionally similar to changes in EPL-treated animals, none of the changes in RV MR target gene expression were significantly different in the spironolactone (SPL) group compared with placebo-treated SuHx rats. Cyp1a1, Edn1, Rgs2, Hk1, Serpine1, Il1r1, Sgk1, Nampt, Nedd4, and Nr3c2 were induced in placebo-treated Su/Hx RV free wall tissue samples relative to normoxic control rat RVs (one-sample Wilcoxon signed-rank test P ≤ 0.1 for all; see Supplemental Fig. S9A for the relative expression of all MR target genes in the placebo group). B: EPL treatment demonstrated a modest and largely consistent overall suppressive effect on RV inflammatory target gene expression compared with placebo-treated SuHx rats, but none of the changes reached statistical significance. In contrast, SPL treatment had more variable effects on RV inflammatory target gene expression. Ccl2, Cola1, Ctgf, Cxcl10, Cxcl12, Cxcl9, Cx3cl1, Icam1, Lgals3, Plat, Ptgs2, Tgfb, Vcam1, and Xirp1 were induced in placebo-treated Su/Hx RV free wall tissue samples relative to normoxic controls (one-sample Wilcoxon signed-rank test P ≤ 0.1 for all; see Supplemental Fig. S9B. for the relative expression of all 22 inflammatory genes in the placebo group). Gene expression determined by quantitative real-time PCR is presented as geometric mean fold-change ± geometric SE of 11–12 animals per group. ΔΔCt values for EPL- and SPL-treated animals were calculated relative to placebo-treated animals within each experimental cycle. When placebo-treated animal samples were not available from within cycle samples (e.g., due to animal loss), placebo-treated animals in temporally adjacent cycles were used instead. Linear mixed models with random batch and animal effects were used to compare gene expression changes in EPL- and SPL-treated animals relative to the placebo group. The horizontal dashed line intersecting the y-axis at 1 highlights no change in mRNA expression relative to placebo-treated animals. *One-tailed P < 0.05 compared with placebo-treated animals.

