Figure 7.
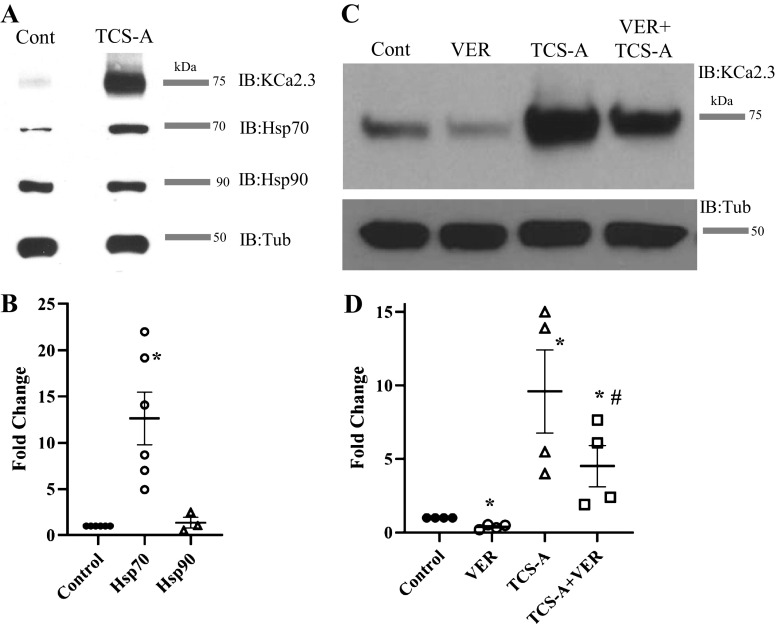
A: TCS-A (1 µM) increases KCa2.3 and HSP70 expression while having no effect on HSP90 expression in HUVECs. B: average responses for five HSP70 experiments and three HSP90 experiments are represented by a dot plot. Results were normalized to the relevant HSP in the absence of TCS-A and the mean ranks are statistically significant vial the Kruskal–Wallis test (P < 0.01). C: the HSP70 inhibitor, VER155008 (VER, 40 µM) decreases KCa2.3 expression under control conditions and inhibits the TCS-A-induced increase in KCa2.3 expression. D: average response for four experiments normalized to control is represented by a dot plot. Tubulin was used as a loading control. *Significant change in KCa2.3 expression compared with control (P < 0.05). #A decrease in expression relative to TCS-A (P < 0.05). HUVECs, human umbilical vein endothelial cells; HSP70, heat shock protein 70; KCa2.3, calcium-activated potassium channel; TCS-A, trichostatin-A.

