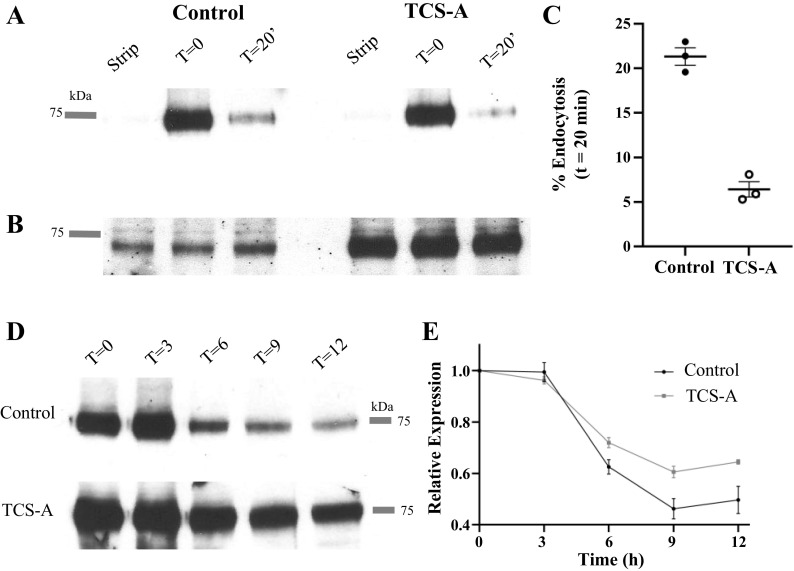
Figure 8.
A: blot showing endocytosis of PM KCa2.3 in HUVECs. Plasma membrane KCa2.3 was biotinylated at 4°C and either immediately pulled down (T = 0) with streptavidin beads, immediately stripped in MESNA (Strip) or incubated at 37°C for 20 min to allow endocytosis, followed by MESNA stripping of the remaining plasma membrane biotin and pulled down. The blot was then probed with α-KCa2.3 Ab. B: IB of total KCa2.3 showing equivalent expression in each condition. KCa2.3 expression was increased in TCS-A-treated cells (1 µM). Different amounts of total protein were used for the control and TCS-A pulldown to facilitate observing endocytosed KCa2.3 in control conditions. C: dot plot comparing percent endocytosis of control and TCS-A-treated HUVECs after 20 min. D: the results of a CHX (400 µg/mL) chase assay are shown for control and TCS-A-treated HUVECS at 0, 3, 6, 9, and 12 h. E: comparison of relative expression levels between TCS-A and control HUVECs (n = 4). Immunoblots were converted to line plots in ImageJ and subsequently quantified. Data from each time point were normalized to expression level at T = 0. The Kruskal–Wallis test was applied at 3, 6, 9, and 12 h and no statistical difference was revealed (P = 1, 0.2482, 0.2482, and 0.5127, respectively). CHX, cycloheximide; IB, immunoblot; HUVECs, human umbilical vein endothelial cells; KCa2.3, calcium-activated potassium channel; TCS-A, trichostatin-A.

