Figure 3.
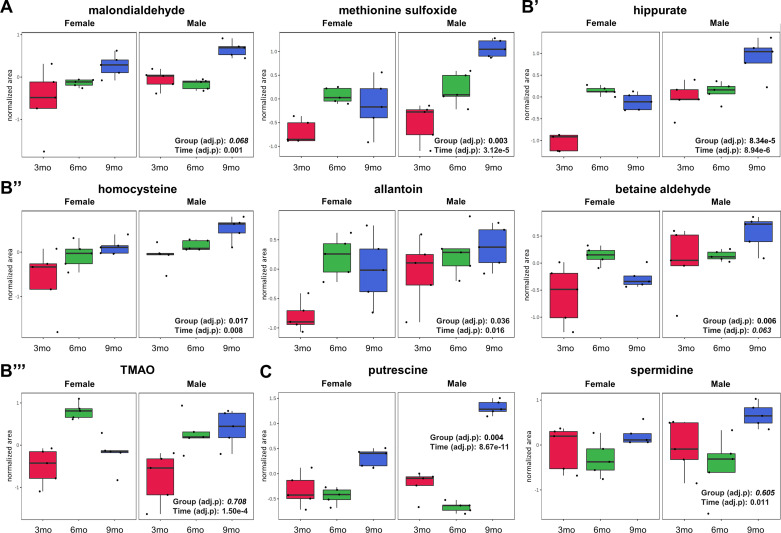
Uremic toxins and oxidative stress markers change significantly with time in the kidneys of Pkd1RC/RC male and female mice. A: oxidative stress markers. B′–B′′′: uremic toxins. C: arginine metabolites. Two-way repeated-measures ANOVA with a false discovery rate of <0.05 was used for statistical analysis (variables of time: 3, 6, and 9 mo and group: male and female). Data are presented as box and whisker plots. Peak normalized areas (analyte areas normalized to the internal standards and tissue weight) were log transformed and Paretto scaled (mean centered and divided by the square root of the SD of each variable). The lines in the boxes represent the median (50th percentile), the boxes represent the 25th and 75th percentile (lower and upper quartiles), and the whiskers represent the minimum and maximum values. Data were analyzed using MetaboAnalyst 5.0 software. TMAO, trimethylamine oxide.

