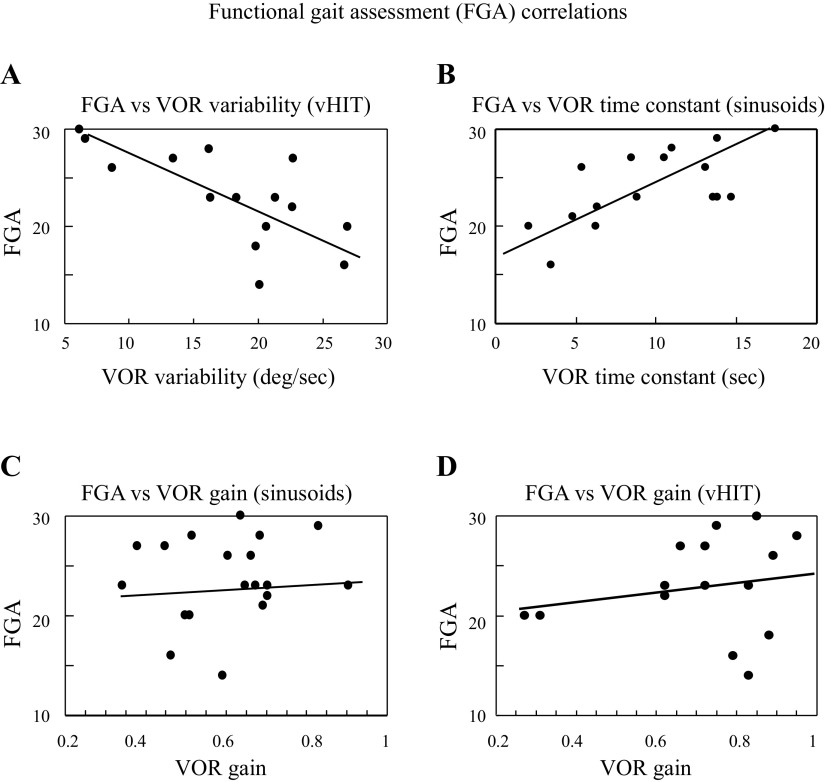
Figure 2.
Scatter plots and linear regressions that demonstrate FGA correlations with vHIT VOR variability (regression: FGA = 32.3 − 0.5 × VOR variability; Pearson R: r = 0.71, P = 0.003; A) and sinusoidal VOR time constant (regression: FGA = 18.7 + 0.6 × VOR time constant; Pearson R: r = 0.66, P = 0.005; B); VOR gains calculated with sinusoidal (regression: FGA = 21.0 + 4.3 × sinusoidal gain; Pearson R: r = 0.14, P = 0.55; C) or vHIT (regression: FGA = 21.2 + 2.1 × vHIT gain; Pearson R: r = 0.12, P = 0.67; D) motion trajectories were not correlated with FGA scores. FGA is scaled from 30 (normal) to 0 (worst). FGA, Functional Gait Assessment; vHIT, vestibular head-impulse tests; VOR, vestibulo-ocular reflex; VS, vestibular schwannoma.

