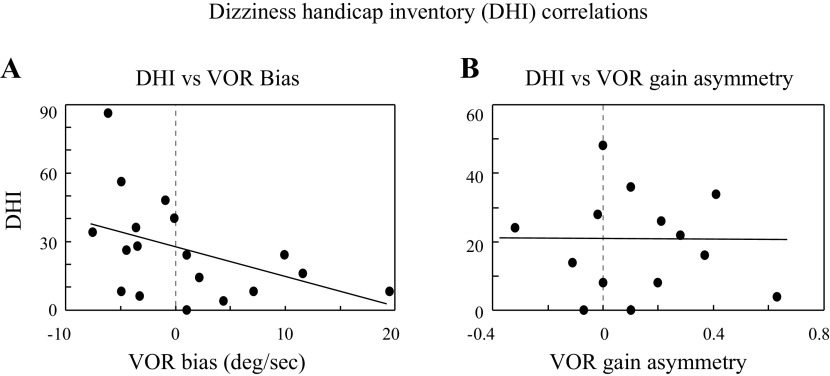
Figure 3.
Scatter plots and regressions showing the relationship between the DHI score [scaled from 0 (normal) to 100 (worst)] and the VOR bias. A: bias measured with sinusoidal motion stimuli. On the x-axis, positive values indicate slow phase bias toward the tumor ear and negative values indicate a bias toward the normal ear. These bias measures include both dynamic VOR asymmetry (difference in VOR gains) and any spontaneous slow phases (reflecting tone asymmetry; 18) and were significantly correlated with the DHI score (regression: DHI = 5.0 − 0.1 × VOR bias; Pearson R: r = 0.47, P = 0.04). B: DHI vs. the symmetry of the dynamic VOR slow phases (gains) elicited with vHIT stimuli. x-Axis is the gain asymmetry (slow phases toward tumor ear − slow phases toward normal ear) so like A, positive values represent a bias toward the tumor ear. vHIT gain asymmetry was not correlated with the DHI score (regression: DHI = 0.2 − 0.01 × gain asymmetry; Pearson R: r = 0.16, P = 0.6). DHI, Dizziness Handicap Inventory; vHIT, vestibular head-impulse tests; VOR, vestibulo-ocular reflex.

