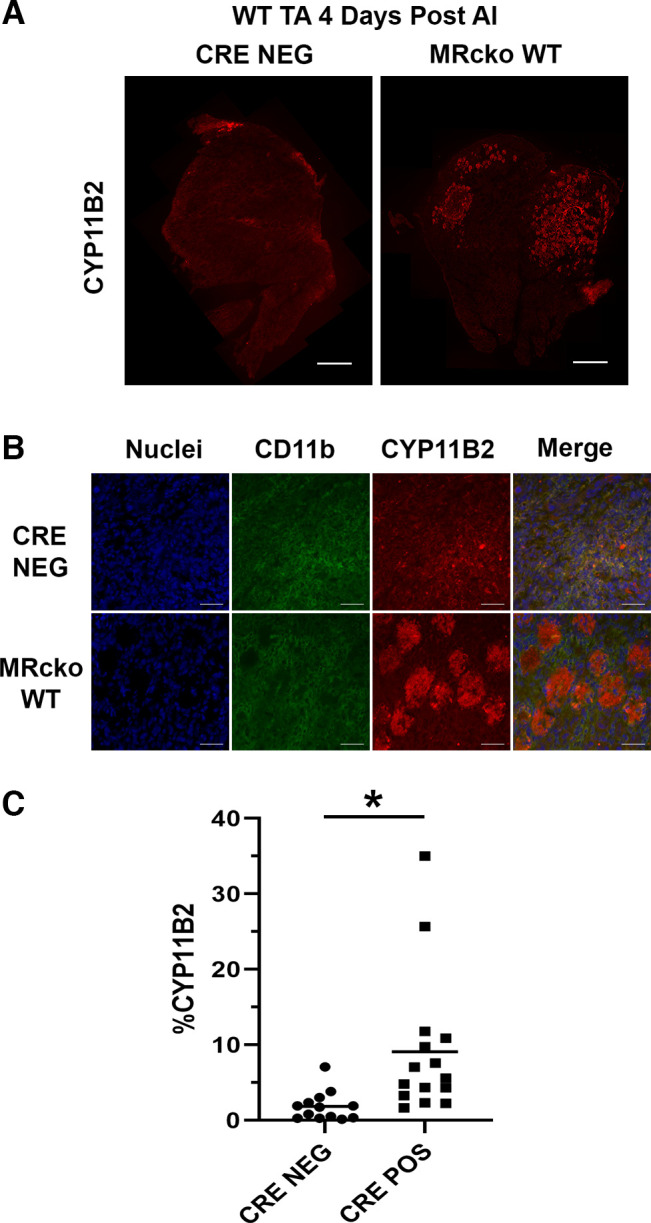
Figure 8.

Analysis of CYP11B2 levels in myeloid mineralocorticoid receptor knockout (MRcko) wild-type (WT) tibialis anterior muscles (TAs) 4 days after acute injury (AI). A: representative composite CYP11B2 (red) images of MRcko WT TAs 4 days after acute injury and WT Cre− controls (n: MRcko = 8 M, 7 F; Cre− = 7 M, 6 F). Scale bars, 500 µm. B: representative zoomed images of MRcko WT TAs 4 days after acute injury and WT Cre− controls, including nuclei (blue), CD11b (green), CYP11B2 (red), and merged images. Scale bars, 100 µm. C: quantification of total area of CYP11B2 staining (%CYP11B2) from MRcko and WT Cre− control TAs 4 days after acute injury. Data displayed in dot plots with mean horizontal line and x-axes labeled with “CRE NEG” for control and “CRE POS” for MRcko. Student’s t test: *P ≤ 0.05.
