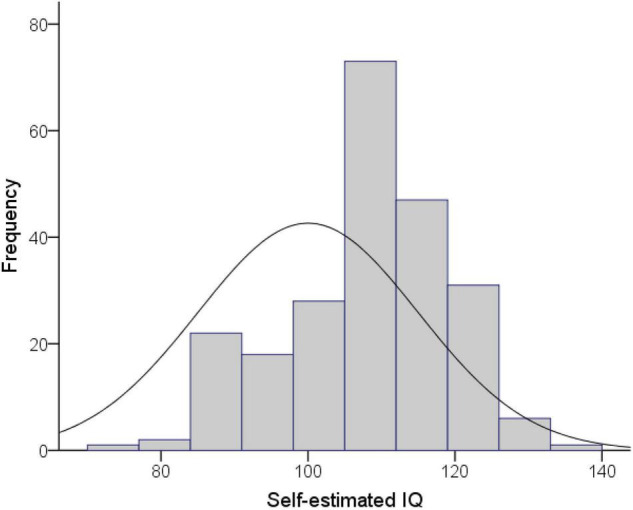
FIGURE 2.

Histogram showing the distribution of self-estimated intelligence in the present sample, alongside the normal distribution of IQ scores in the general population. Our sample was significantly negatively skewed with the bulk of scores shifted to the right of the normal curve.
