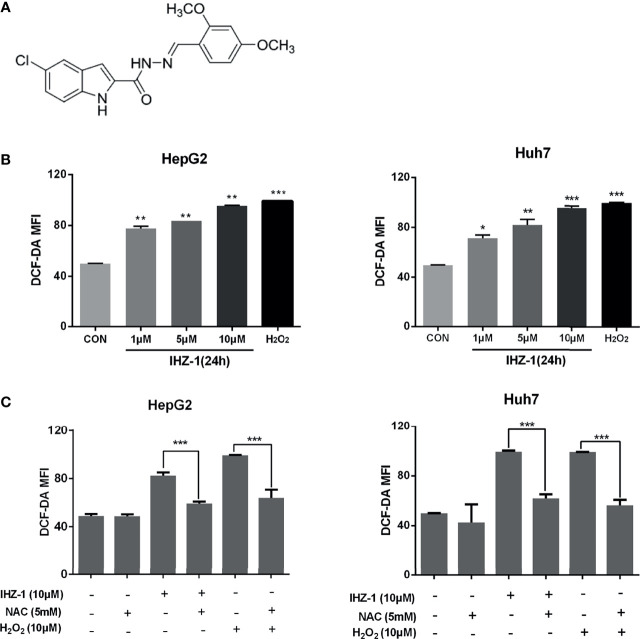
Figure 1.
IHZ-1 induced ROS generation in HCC cells. (A) Structural formula of compound IHZ-1. (B) Intracellular ROS level were measured by fluorescence microscope with DCFH-DA staining after IHZ-1 treatment (C) or pretreated with NAC and analyzed by flow cytometer. *p < 0.05, **p < 0.01, and ***p < 0.001.

