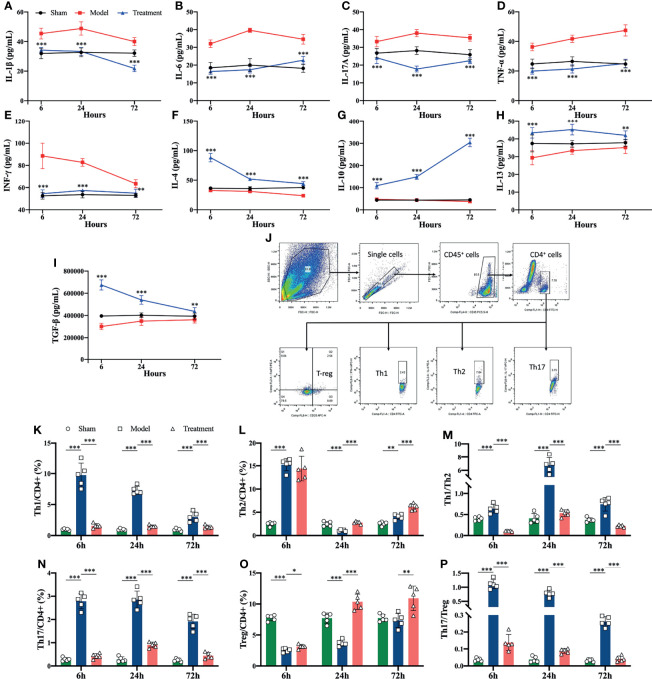
Figure 3.
Inflammatory cytokine levels and proportions of Th cell subpopulations in peripheral blood of rats in each group. (A–I) Inflammatory cytokine levels in serum of rats in each group (*compared with the model group); (J) circle gating strategy for flow cytometry analysis of peripheral blood Th cell proportions; (K, L, N, O) flow analysis of the proportions of Th1, Th2, Th17, and Treg cells in peripheral blood as a percentage of CD4+ T cells; (M) ratio of Th1/Th2 in peripheral blood of rats in each group; (P) ratio of Th17/Treg in peripheral blood of rats in each group. n=5, *p<0.05, **p<0.01, ***p<0.001.

