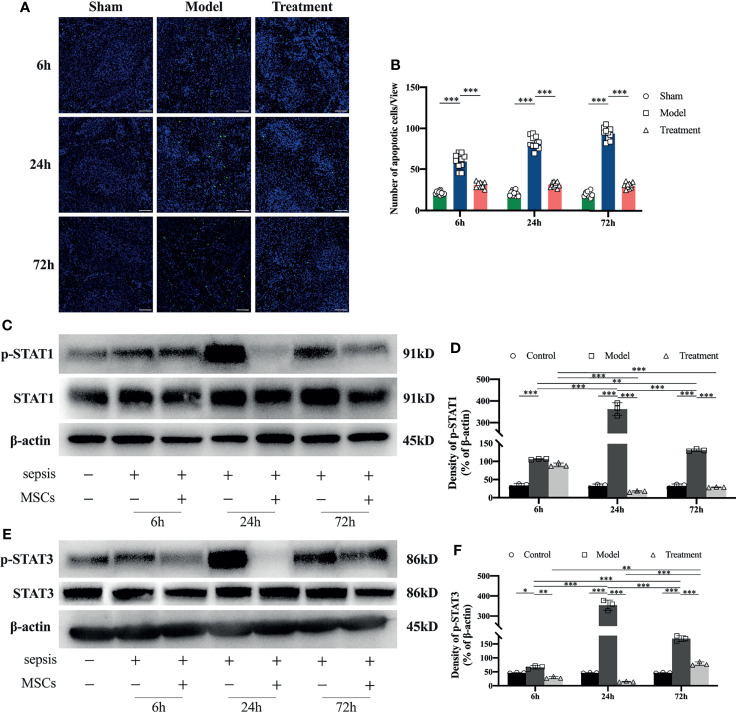
Figure 5.
Tunel staining and STAT1 and STAT3 expression levels in the spleen of rats in each group. (A) Apoptosis of spleen lymphocytes at 6h, 24h and 72h in each group of rats (n=5, scale bar=100mm); (B) number of apoptotic cells per field of view in each group of rats; (C, D) expression levels and semi-quantitative analysis of STAT1 and p-STAT1 in spleen tissue of each group of rats (n=3); (E, F) expression levels and semi-quantitative analysis of STAT3 and p-STAT3 in spleen tissue of each group of rats (n=3). *p<0.05, **p<0.01, ***p<0.001.

