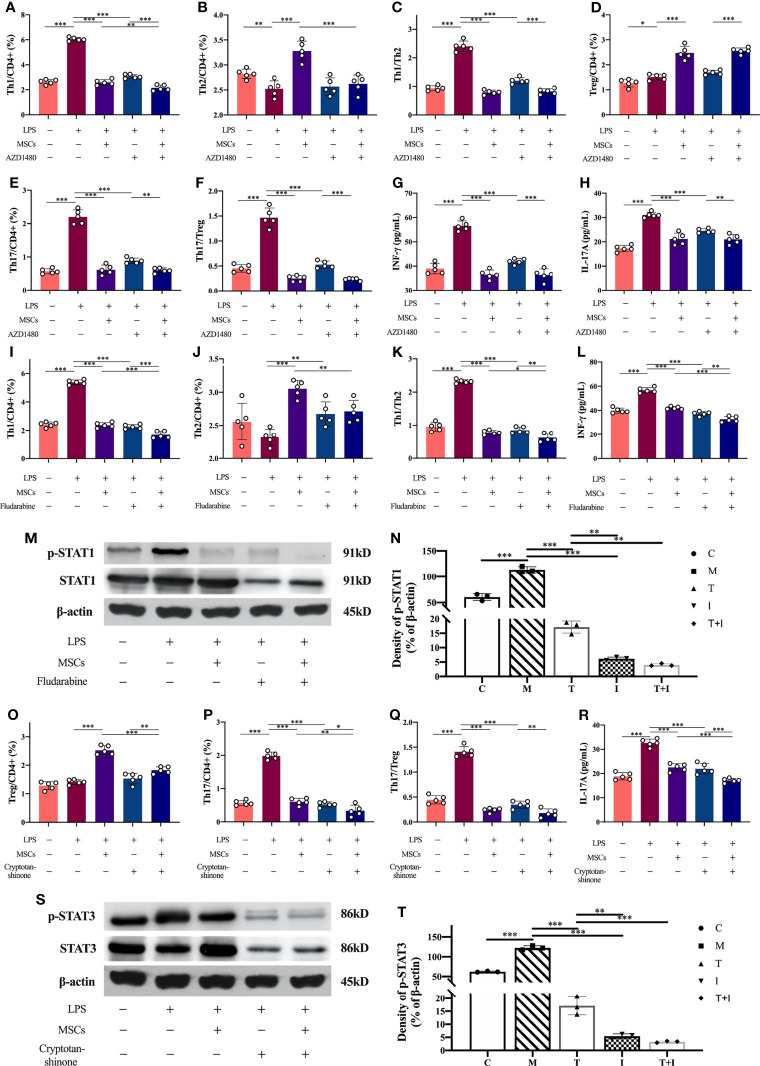
Figure 7.
Levels of inflammatory factors in cell supernatants and the proportion of Th cells in lymphocytes and the expression levels of STAT1 and STAT3 in each group after the use of inhibitors. Lymphocytes isolated from rat spleen were co-cultured with MSCs at a ratio of 10:1, and the inhibitors used and the co-culture time was 24hours. The concentrations of the inhibitors used in the experiment were AZD1480 (5μM), fludarabine (100μM) and cryptotanshinone (50μM). (A–F) Proportions of Th1, Th2, Th17 and Treg cells in CD4+ T cells and the ratios of Th1/Th2 and Th17/Treg in each experimental group after the use of JAK inhibitors (n=5); (G) levels of IFN-γ in the supernatant of each experimental group after the use of JAK inhibitors (n=5); (H) levels of IL-17A in the supernatant of each experimental group after the use of JAK inhibitors (n=5); (I–K) Proportions of Th1 and Th2 cells in CD4+ T cells and Th1/Th2 ratio in each experimental group after using STAT1 inhibitor (n=5); (L) levels of IFN-γ in cell supernatants in each experimental group after using STAT1 inhibitor (n=5); (M, N) expression levels of STAT1 and p-STAT1 in lymphocytes in each experimental group and the results of semi-quantitative analysis (n=3); (O–Q) Proportions of Th17 and Treg cells to CD4+ T cells and Th17/Treg ratio in each experimental group after using STAT3 inhibitor (n=5); (R) Levels of IL-17A in cell supernatants of each experimental group after using STAT3 inhibitor (n=5); (S, T) Expression levels of STAT3 and p-STAT3 in lymphocytes of each experimental group and the results of semi-quantitative analysis (n=3). *p<0.05, **p<0.01, ***p<0.001; C, control group; M, model group; T, treatment group; I, inhibitor group; T+I, inhibitor+MSCs group.

