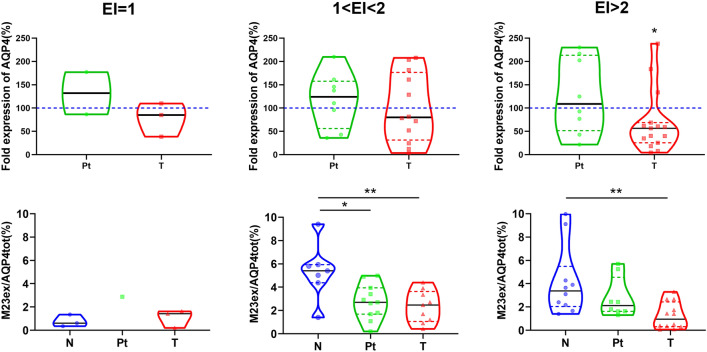
Fig. 5.
Expression of AQP4 and AQP4ex in correlation with the edema index (EI). Top: violin plots reporting AQP4 expression levels in the GBM regions (Pt and T) of each EI category compared to N samples (dotted blue line) seats at 100%. Bottom: relative amount of the M23ex isoform to the global AQP4 expression in the same GBM samples. Blue, green and red dotted lines represent the upper and lower quartile in each distribution. *p < 0.05, **p < 0.001: Kruskal–Wallis, post test: Dunn's multiple comparisons test

