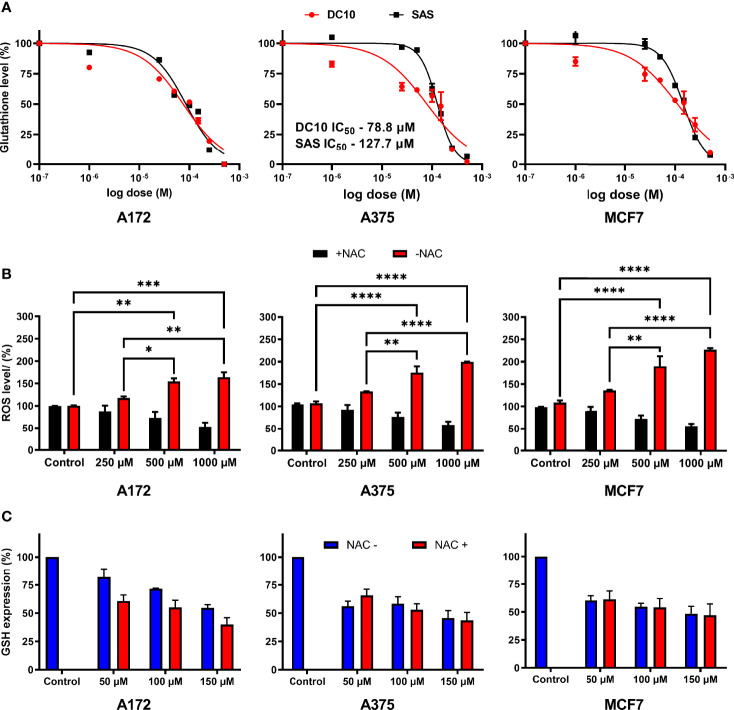
Figure 2.
Dose-dependent effect of DC10 on GSH and ROS levels in cancer cell lines. (A) GSH levels in the A172, A375 and MCF7 cell lines in controls and after DC10 treatment with doses as indicated. (B) ROS levels after DC10 treatment with doses as indicated. *P < 0.05, **P < 0.01, ***P < 0.001, ****P < 0.0001. (C) GSH expression in DC10 treated cells in the presence or absence of NAC as indicated.

