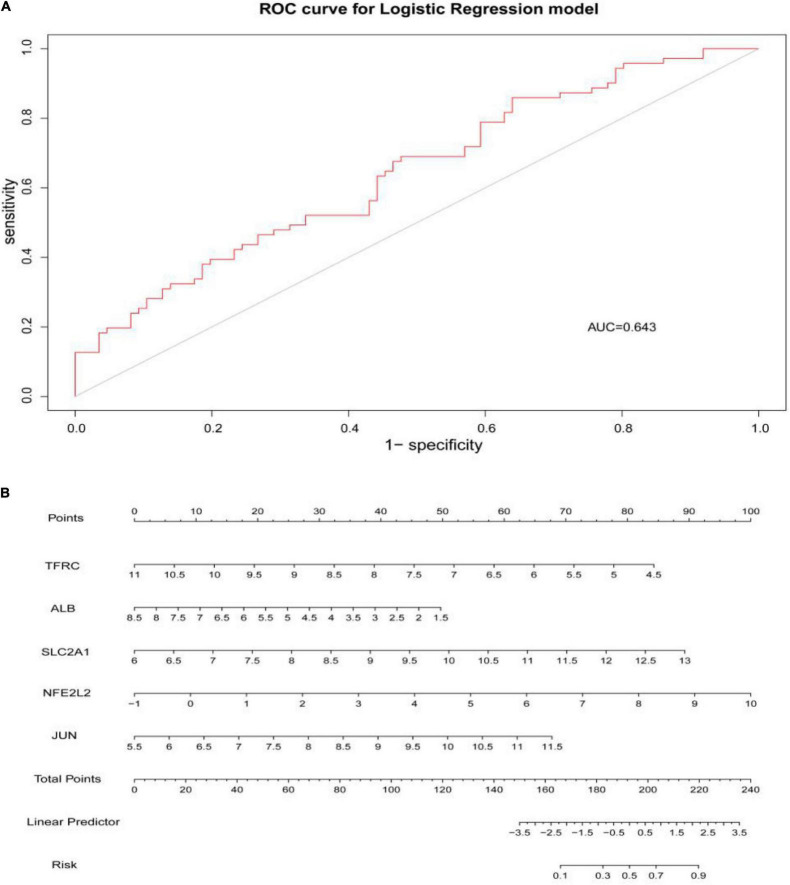
FIGURE 7.
(A) ROC curve was used to evaluate the performance of the logistic regression model. The area under the curve (AUC) was 0.643. (B) The nomogram was used to predict the occurrence of AD. Ferroptosis-related hub genes, JUN, SLC2A1, TFRC, ALB, and NFE2L2 (P < 0.05), were included in this nomogram.

