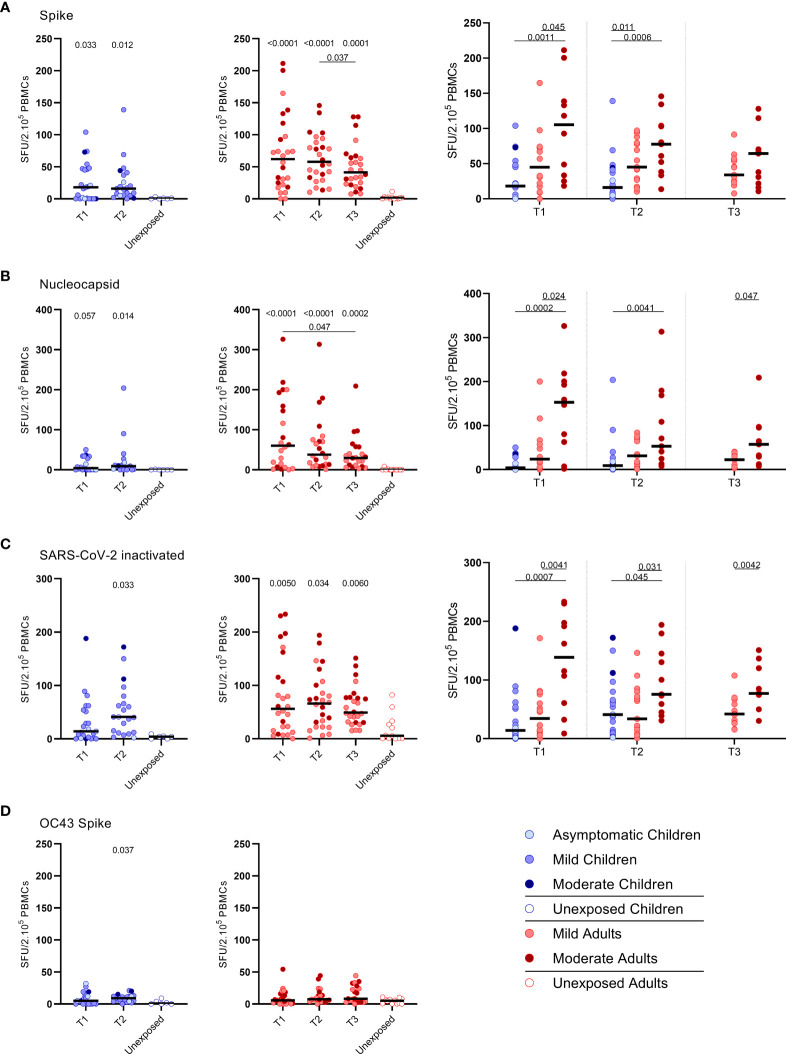
Figure 1.
SARS-CoV-2-specific IFN-γ+ T cell response in infected children and infected adults (mild and moderate cases) versus unexposed healthy controls over time after infection. Dot plots summarizing the frequencies of IFN-γ-producing cells responding to SARS-CoV-2 and HCoV-OC43 antigens for (A–D) children (left panel, blue), adults (middle panel, red), and children versus mild and moderate adult cases separately (right panel), over time after infection, and compared to unexposed adults/children (ELISPOT assay). Frequencies of IFN-γ-producing cells responding to (A) set of overlapping peptides of SARS-CoV-2 spike protein, (B) set of overlapping peptides of SARS-CoV-2 nucleocapsid protein, (C) inactivated SARS-CoV-2, and (D) set of overlapping peptides of HCoV-OC43 spike protein. Each dot represents one subject. Bars indicate the median of spot-forming units per 200,000 PBMCs. SFU, spot-forming unit. (A–D) P values related to comparisons with the unexposed controls are listed at the top of the graph, above the corresponding group for comparison. For unpaired comparisons, Mann-Whitney U test (two-group comparisons) (mild adults versus moderate adults) or Kruskal-Wallis rank-sum test with Dunn’s post hoc test for multiple comparisons were used (children versus mild adults versus moderate adults; unexposed versus infected children or adults at T1 versus T2 versus T3). Differences between paired data were compared using the Wilcoxon signed-rank test (for comparison of two paired groups) (infected children at T1 versus T2) or the Friedman test with Dunn’s multiple comparison tests (infected adults at T1 versus T2 versus T3). Statistically significant comparisons are indicated, with P values < 0.05 considered significant. T1, first timepoint of sampling for adults median 12.5 days and children median 8 days post-symptom onset; T2, 10-14 days after T1; T3, 4-6 weeks after T1.

