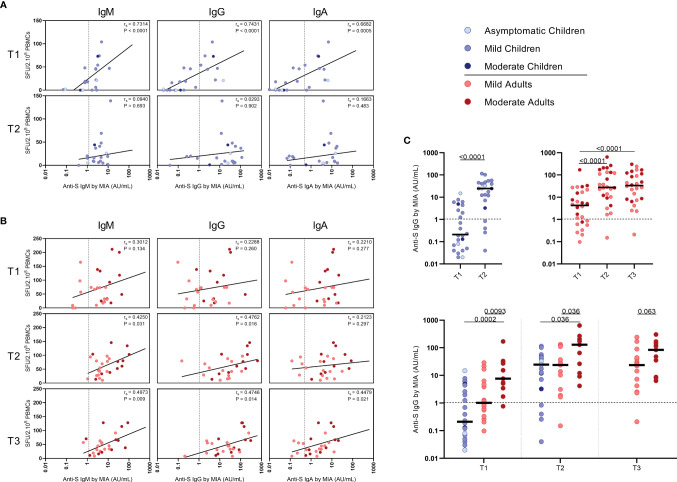
Figure 5.
Correlation between frequencies of SARS-CoV-2-specific IFN-γ+ T cells and antibody concentrations to S1-SARS-CoV-2. Spearman correlation between frequency of SARS-CoV-2-specific IFN-γ+ responder cells and concentrations of spike-S1 IgM, IgG, or IgA serum antibodies measured by multiplex immunoassay (MIA) at different time points after infection in (A) children and (B) adults. Concentrations of spike-S1 IgG serum antibodies at the various time points after SARS-CoV-2 infection in the whole group of children and adults (C, upper panel) and in the whole group of children versus the mild and moderate adult cases (C, lower panel). Cut-off values for seroprevalence are indicated with vertical or horizontal dotted lines. Each dot represents one subject. Correlation coefficients (rs) were determined with Spearman’s rank correlation. P values < 0.05 were considered significant. Differences in IgG concentrations for paired data were compared using the Wilcoxon signed-rank test (for comparison of two paired groups) (infected children at T1 versus T2) or the Friedman test with Dunn’s multiple comparison tests (infected adults at T1 versus T2 versus T3). For unpaired comparisons, Mann-Whitney U test (two-group comparisons) (mild adults versus moderate adults) or Kruskal-Wallis rank-sum test with Dunn’s post hoc test for multiple comparisons were used (children versus mild adults versus moderate adults; at T1 versus T2 versus T3). Statistically significant comparisons are indicated, with P values < 0.05 considered significant. T1, first timepoint of sampling for adults median 12.5 days and children median 8 days post-symptom onset; T2, 10-14 days after T1; T3, 4-6 weeks after T1.

