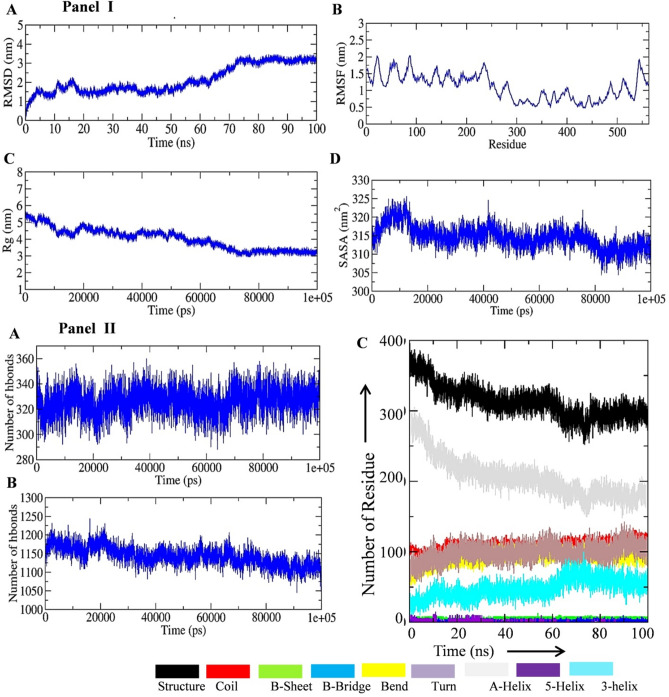
Fig. 5.
Molecular dynamics simulation trajectory plot of final vaccine construct. A The RMSD of the final vaccine construct during 100 ns MD simulation. B The RMSF of the final vaccine construct during 100 ns MD simulation. C The Rg values of the final vaccine construct during 100 ns MD simulation. D The SASA of the final vaccine construct during 100 ns MD simulation (Panel I). Hydrogen bond formation and secondary structure change in the final vaccine construct during the MD simulation period. A Hydrogen bond formation within the final vaccine structure. B Hydrogen bond formation between final vaccine structure and surrounding water molecules. C Change in secondary structure during the 100 ns MD simulation period of the final vaccine construct (Panel II)

