Figure 6.
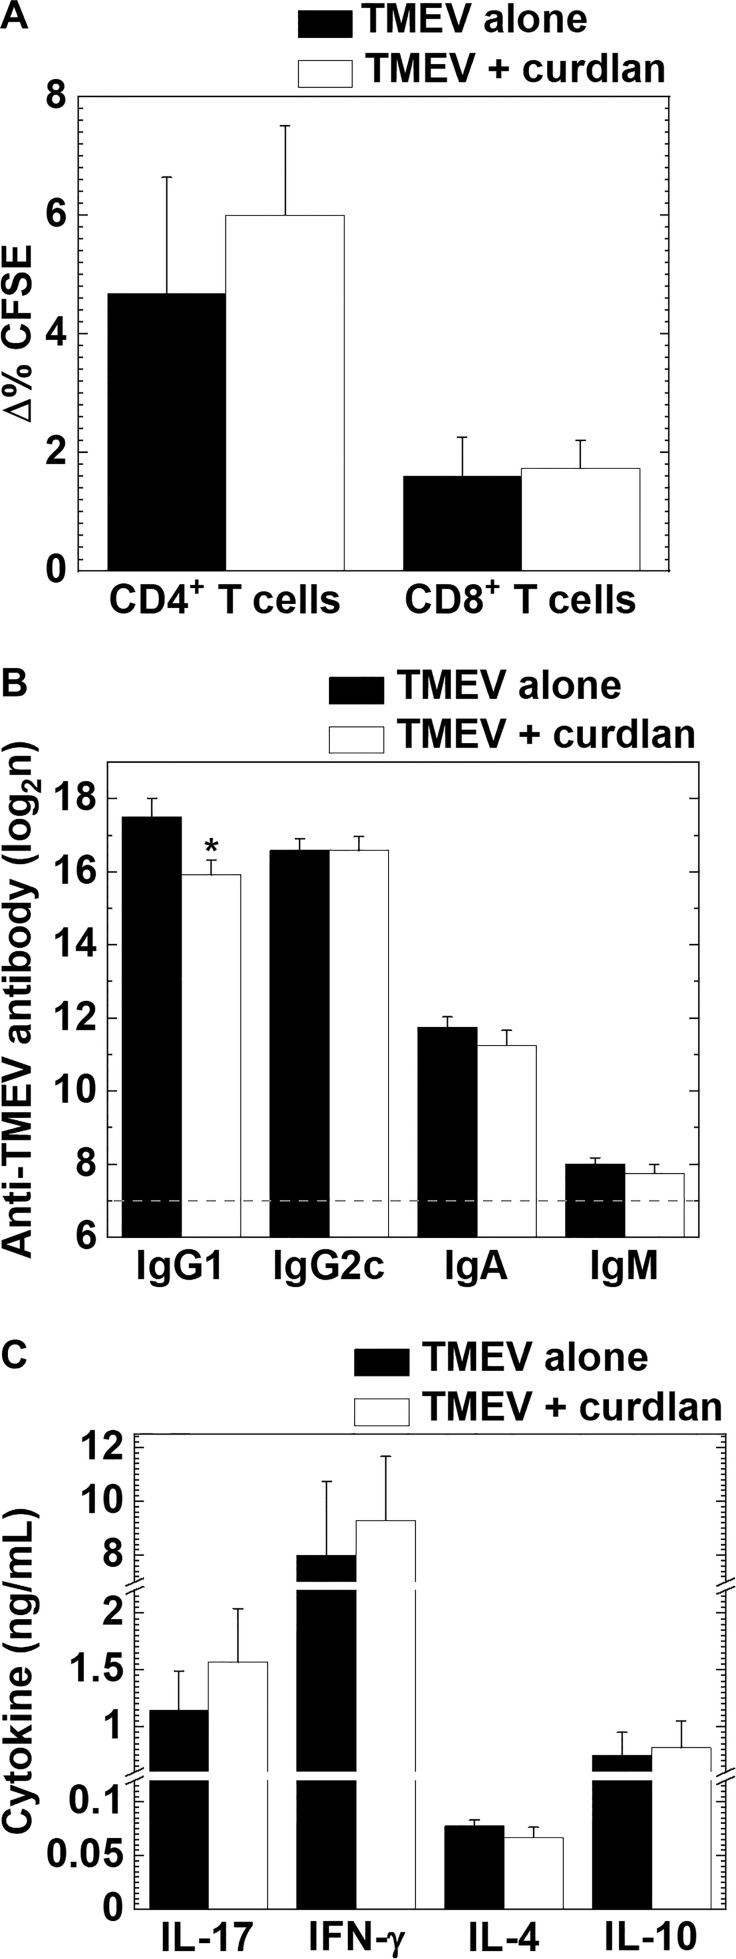
TMEV-specific T cell proliferation and antibody responses, and cytokine productions in TMEV-IDD with or without curdlan treatment. (A) We found similar levels of TMEV-specific CD4+ T cell and CD8+ T cells responses between the control (TMEV alone, black bar) and curdlan-treated (TMEV/curdlan, white bar) mice 5–6 weeks p.i. Values of TMEV-specific lymphoproliferative responses were expressed as Δ% CFSE: (mean CFSE-positive cell % in TMEV-APC stimulation) − (mean CFSE-positive cell % in control-APC stimulation). (B) Although the curdlan treated group had lower serum anti-TMEV IgG1 titers compared with the control group, anti-TMEV IgG2c, IgA, and IgM titers were similar between the two groups 5–6 weeks p.i. The dotted line indicates the detection limit. *P < 0.05, Student’s t-test. (C) IL-17, IFN-γ, IL-4, and IL-10 production from splenic MNCs of the control and curdlan-treated mice 5–6 weeks p.i. Antibody titers and cytokine concentrations were determined by ELISAs. (A–C) Values are the mean + SEM from eight to twelve mice per group.

