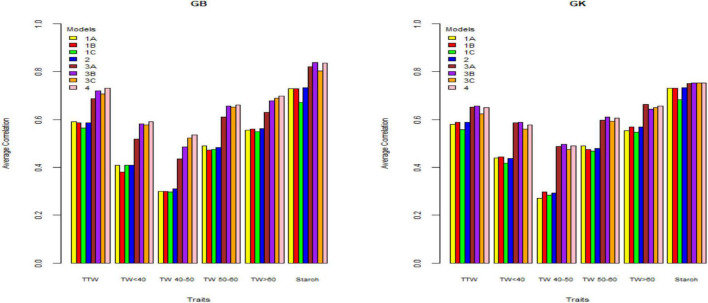
FIGURE 2.
Genome-based predictions (average correlation between observed and predicted values) of potato cultivars in Mosslunda site for total tuber weight (TTW), tuber weight with size below 40 mm (TW < 40), tuber weight with 40–50 mm (TW 40–50), tuber weight with 50–60 mm size (TW 50–60), tuber weight above 60 mm size (TW > 60), and tuber starch percentage (Starch) considering single environment pseudo-diploid (A) (model 1) (1A), additive tetrasomic polyploid (B) (model 1) (1B), full tetraploid (C) (model 1) (1C), and B-C (model 2) (2) and multi-environment pseudo-diploid (A) (model 3) (3A), additive tetrasomic polyploid (B) (model 3) (3B), full tetraploid (C) (model 3) (3C), and B-C (model 4). These models (1–4) with marker matrices A, B, and C (1A, 1B, 1C, 2, 3A, 3B, 3C, and 4) were combined with linear kernel GB (GBLUP) and non-linear kernel GK (Gaussian kernel).

