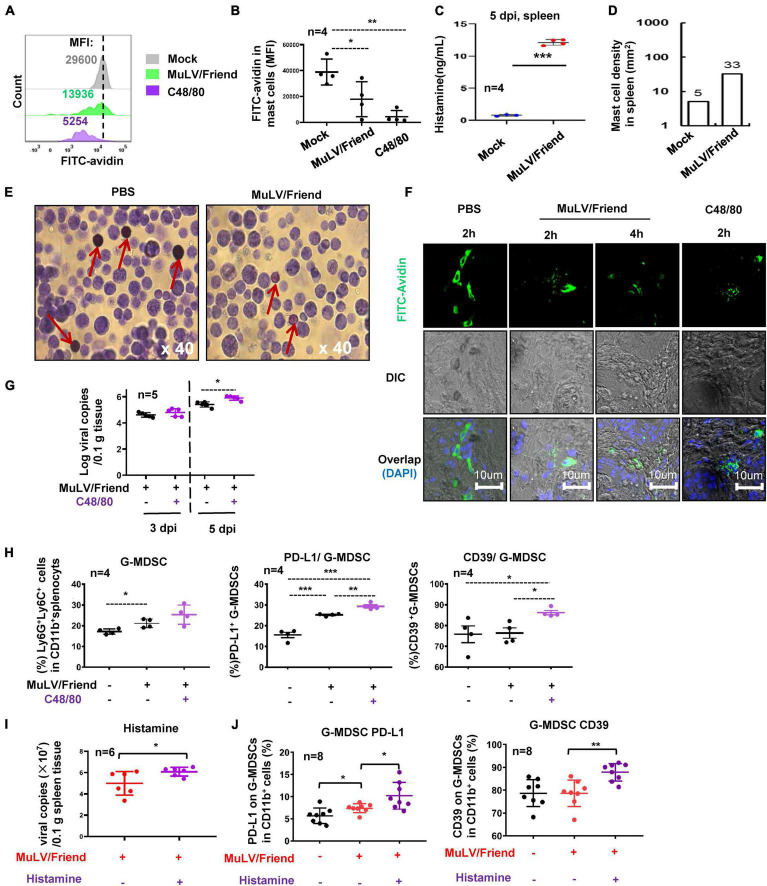
FIGURE 4.
Mast cell activation promotes viral infection. (A–C) Virus and C48/80 induces MC degranulation. C57BL/6 mice were treated i.p. with MuLV/Friend (1 × 10⁹ copies) or C48/80 (1 mg/kg) for 2 h. The PBS was used as the mock-infection control. The degranulation from c-Kit+ FcεRI+ splenic mast cells were measured with the immunostaining of cytoplasmic avidin granules, and the mean fluorescence intensity (MFI) was calculated. The MC degranulation from four mice were summarized (B). The released histamine in spleen at 5 dpi was measured with ELISA (C), and MC accumulation at 5 dpi in the spleen tissue section was calculated (D). (E) peritoneal MC degranulation. C57BL/6 mice were infected with MuLV/Friend (1 × 10⁹ copies) for 2 h, and the peritoneal cells were harvested and stained with Toluidine blue to show the degranulation of peritoneal MCs. The red rows indicate MCs. (F) Retrovirus-induced MC degranulation in footpad tissue. C57BL/6 mice were s.c. infected with MuLV/Friend virus (1 × 10⁸ copies) in the footpads. The frozen footpad sections were intracellularly immunostained with FITC-avidin to observe MC degranulation. C48/80 (1 mg/kg) was administered along with MuLV/Friend infection of WT mice as above, at 5 dpi, (G) viral loads in spleen were quantified, and (H) the frequency and phenotype of G-MDSCs in spleen were profiled. WT mice were administrated with histamine (2.5 mg/kg) via i.p. during viral infection as above, at 5 dpi, viral load in spleen was measured (I), and the phenotype of G-MDSCs in spleen were profiled (J). One-way ANOVA was performed to analyze significance differences. Data are presented as mean ± SD. *p < 0.05, **p < 0.01 and ***p < 0.001 are considered significant differences.

