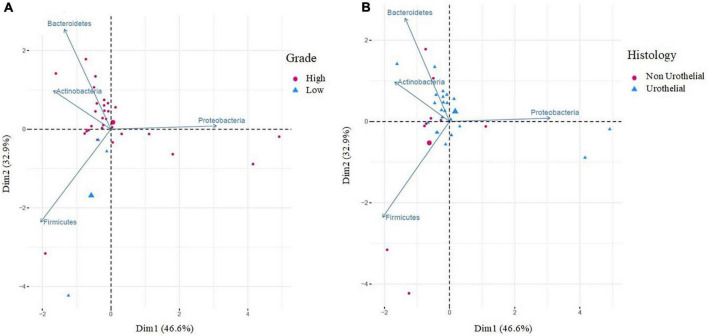
FIGURE 3.
Principal component analysis (PCA) of bacteria according to the grade of the tumor (A) and histology (B), at the phylum level. PCA (A) shows the microbial community composition of tumor tissues in relation to high grade (red cicles, n = 29) and low grade (blue triangles, n = 3). PCA (B) shows the microbial community composition of tumor tissues in relation to histology: non-urothelial (red cicles, n = 9) and urothelial (blue triangles, n = 22). Principal component (PC1 and PC2) together, account for 79.5% of the variance in these data.

