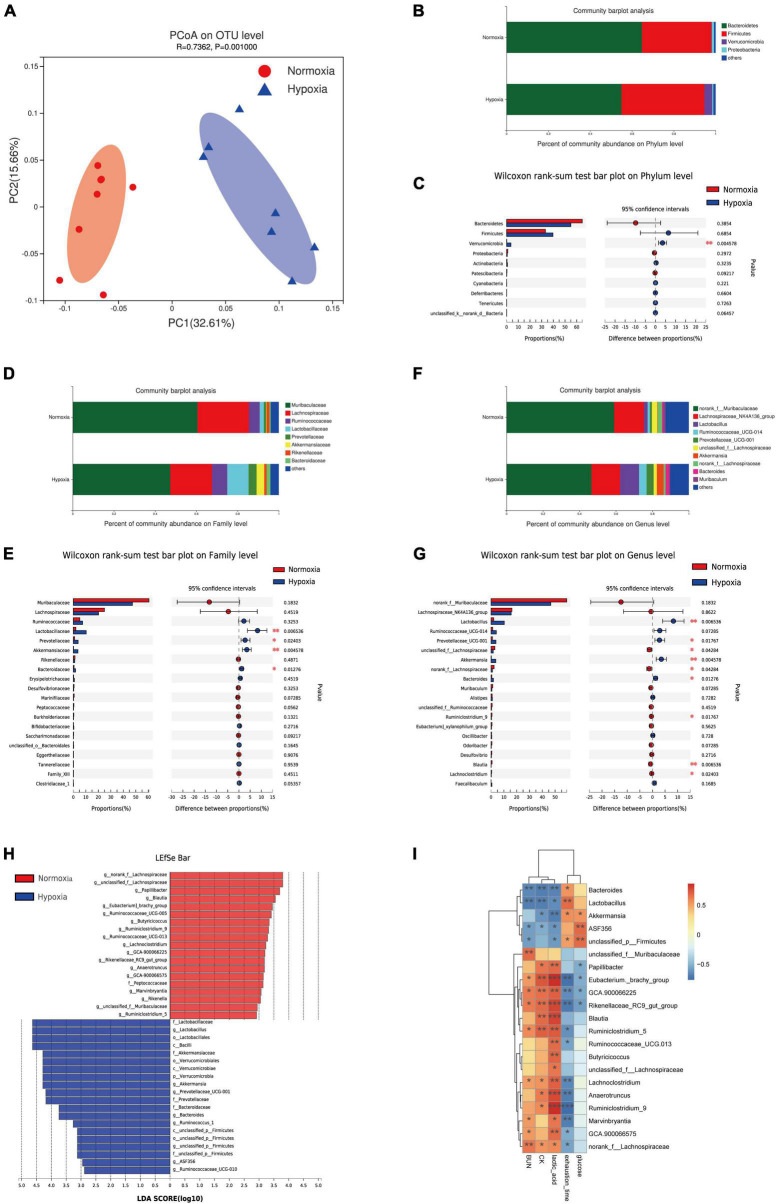
FIGURE 2.
Hypoxia treatment modified the gut microbiota. (A) Principal coordinate analysis (PCoA) of the β-diversity based on the unweighted UniFrac distance matrix (at the OTU level). Taxonomic distributions at the phylum level (B), and the Kruskal-Wallis H test bar plot at the phylum level (C). Taxonomic distributions at the family level (D), and the Kruskal-Wallis H test bar plot at the family level (E). Taxonomic distributions at the genus level (F), and the Kruskal-Wallis H test bar plot at the genus level (G). (H) Bar graph of linear discriminant analysis (LDA) scores, showing the biomarker taxa (LDA score of > 2 and a significance of p < 0.05 determined by the Wilcoxon signed-rank test). (I) Heatmap of Pearson’s correlation analysis between the key gut microbial taxa at the genus level and fatigue related factors. *p < 0.05, **p < 0.01, ***p < 0.001.

